Pattern #17: Least Or Most Expensive First

Pattern #17  Tested 7 timesFirst tested by Kuba Koziej Recently tested by Melina Hess on Aug 13, 2024

Based on 7 Tests, Members See How Likely Version B Wins Or Loses And By How Much

LOSSES
-5
-4
-3
-2
-1
FLAT
+1
+2
+3
+4
+5
WINS

Measured by the sum of negative and positive tests.
A B
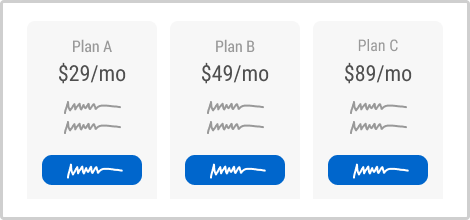
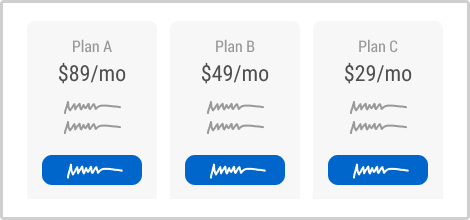
Least Or Most Expensive First (Variant A) Least Or Most Expensive First (Variant B)

Expected Median Effects Of B

-

Progression

-

Leads

-

Signups

-

Engagement

?

Sales

(7 tests)

?

Revenue

(7 tests)

-

Retention

-

Referrals

?

ANY PRIMARY

(7 tests)

Tests

Pattern #17: Least Or Most Expensive First
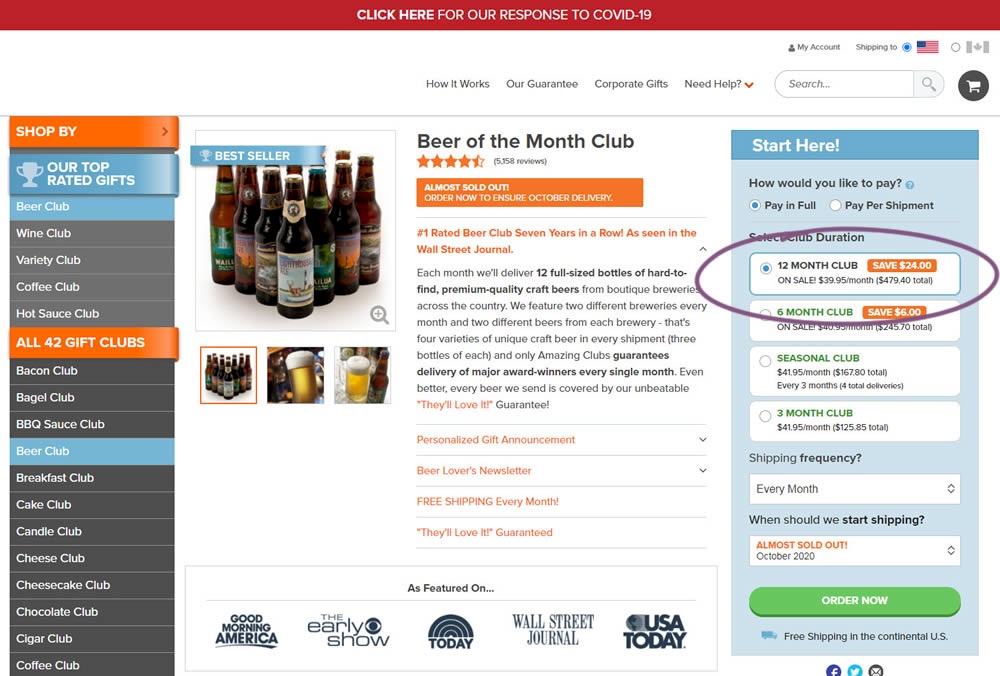
Was Tested On Kenhub.com by Niels Hapke

Replaced

Isolated

Test # 130 on Kenhub.com by $conducted_test->test->user_->first_name . ' ' . $conducted_test->test->user_->last_name Niels Hapke    Dec 07, 2017 Test link

Find Out How It Did

  • Measured by total purchases of any plan

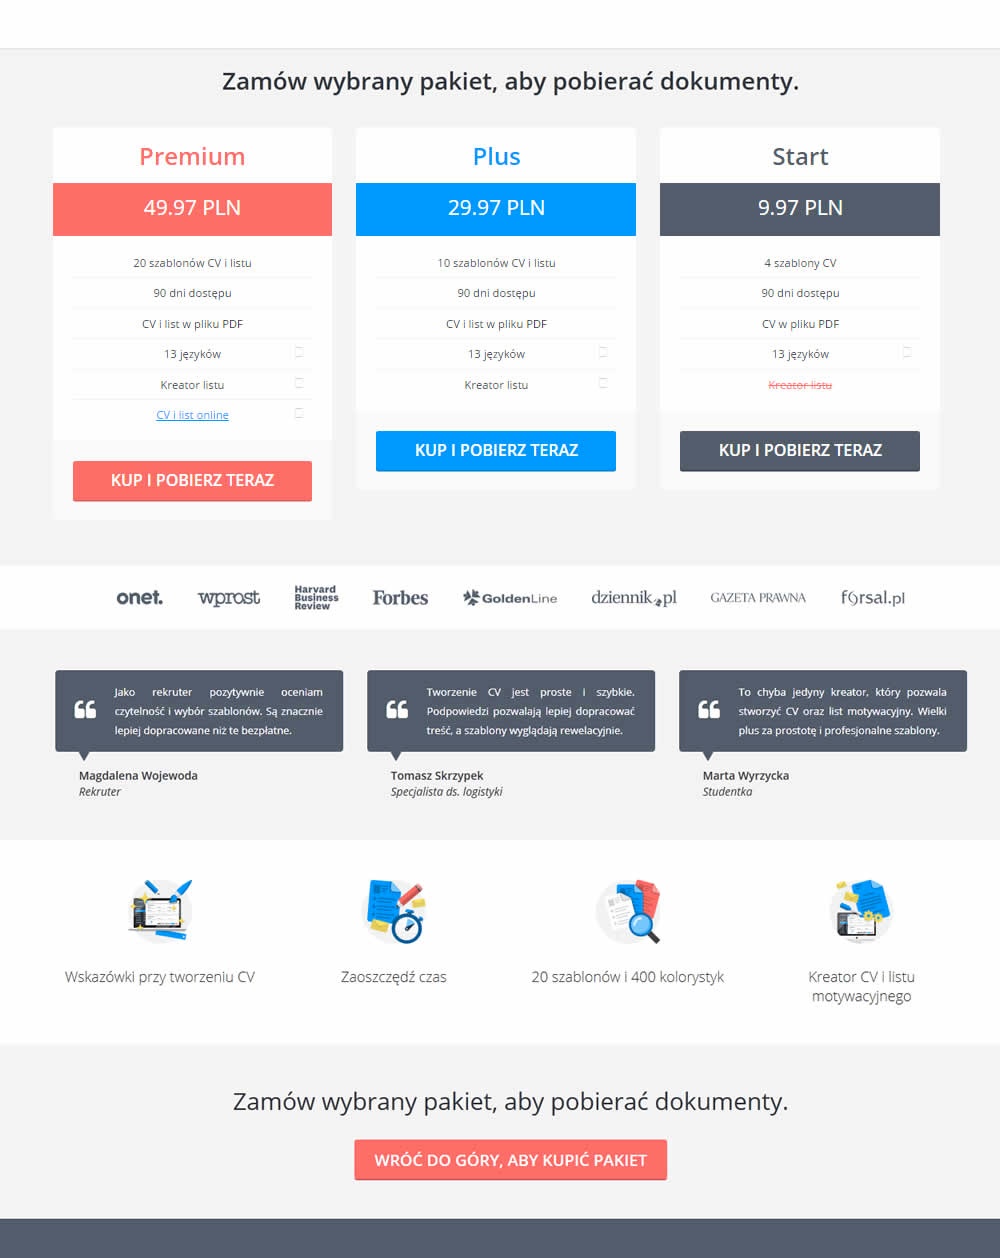
In this experiment, the plans were sorted by the most expensive first, left to right (variation).

Get Access To See The Test Results

The Same Pattern Was Also Tested Here

Replaced

Isolated

Test # 548 on Livefresh.de by $conducted_test->test->user_->first_name . ' ' . $conducted_test->test->user_->last_name Melina Hess    Aug 13, 2024 Test link

Find Out How It Did With 272,793 Visitors

  • Measured by Revenue per user

  • Measured by sales

In this product landing page experiment, the plan sort order was rearranged. In the control it was sorted from least expensive to most expensive. In the variation, the plans were shown as most expensive first. Impact on sales and revenue was measured.

Get Access To See The Test Results

Replaced

Isolated

Test # 324 by $conducted_test->test->user_->first_name . ' ' . $conducted_test->test->user_->last_name Jakub Linowski    Oct 30, 2020 Test link

Find Out How It Did With 31,768 Visitors

  • Measured by total sales

  • Measured by total revenue

This experiment tested the order of purchase plans. The control version sorted the purchase options by the least expensive while the variation sorted them by the most expensive first. Impact on sales and revenue was measured.

Get Access To See The Test Results

Replaced

Isolated

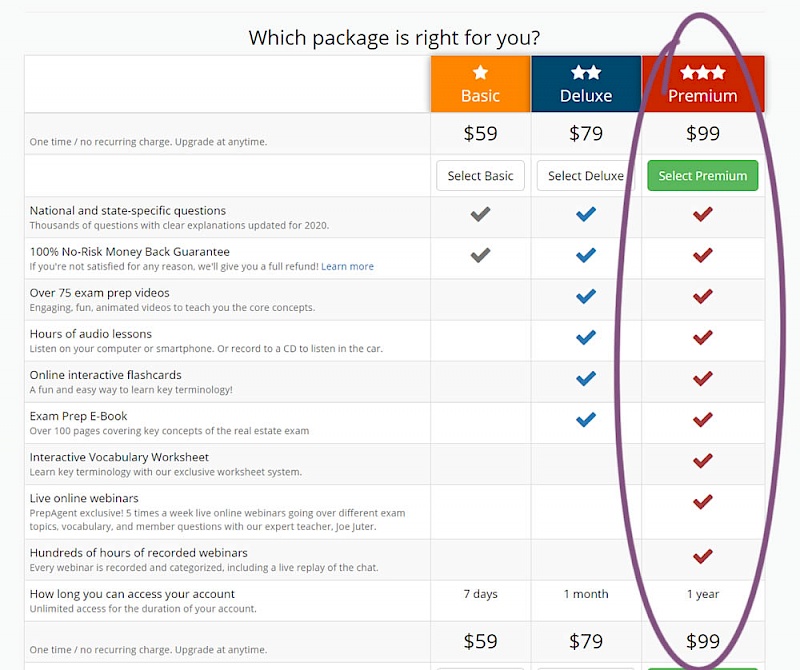
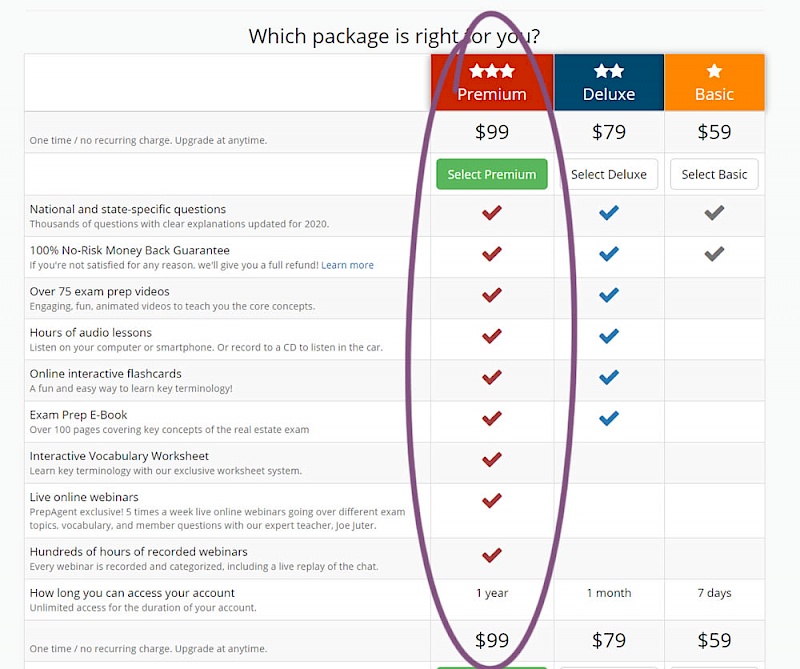
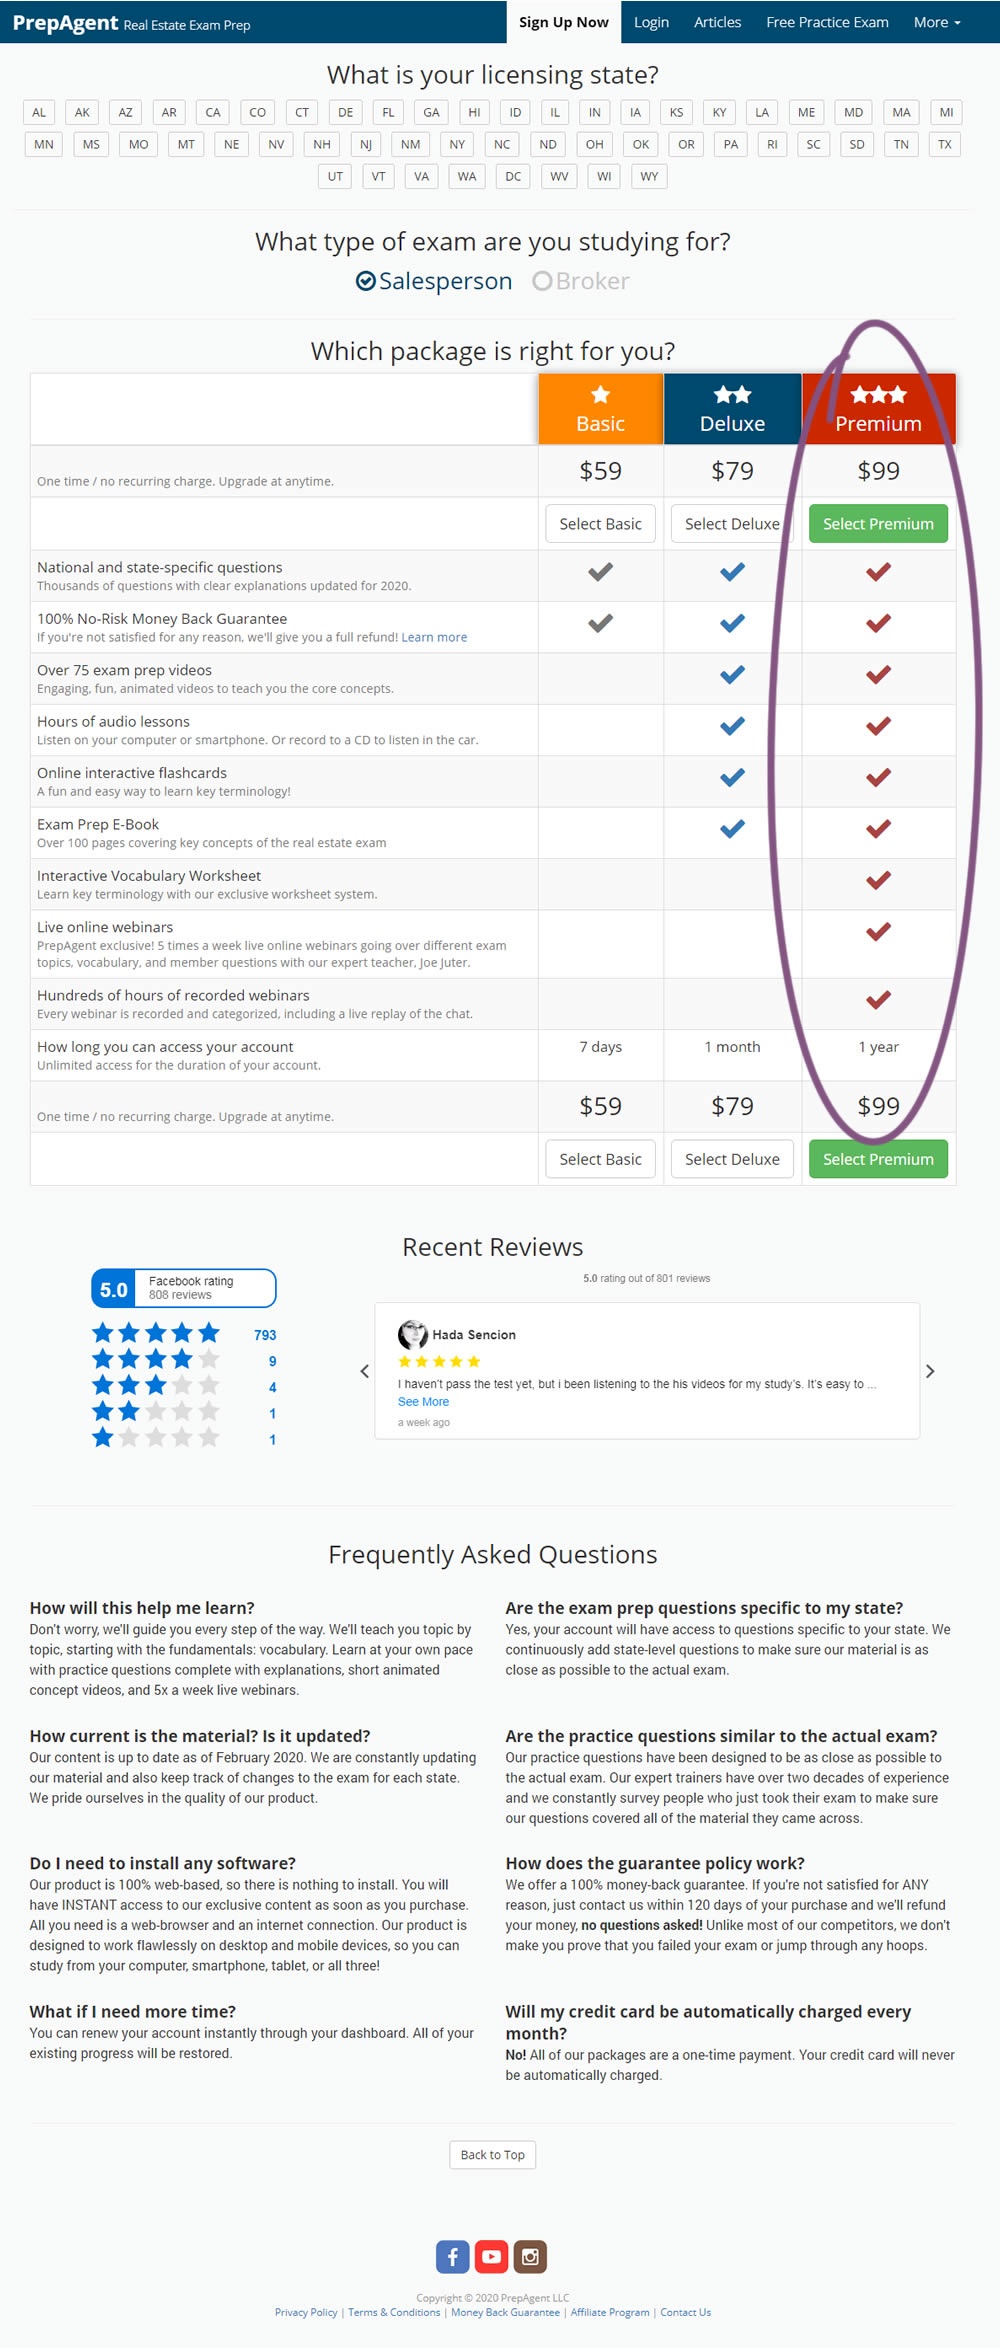
Test # 289 on Prepagent.com by $conducted_test->test->user_->first_name . ' ' . $conducted_test->test->user_->last_name Arthur Sparks    Mar 23, 2020 Test link

Find Out How It Did

  • Measured by total sales

  • Measured by total revenue

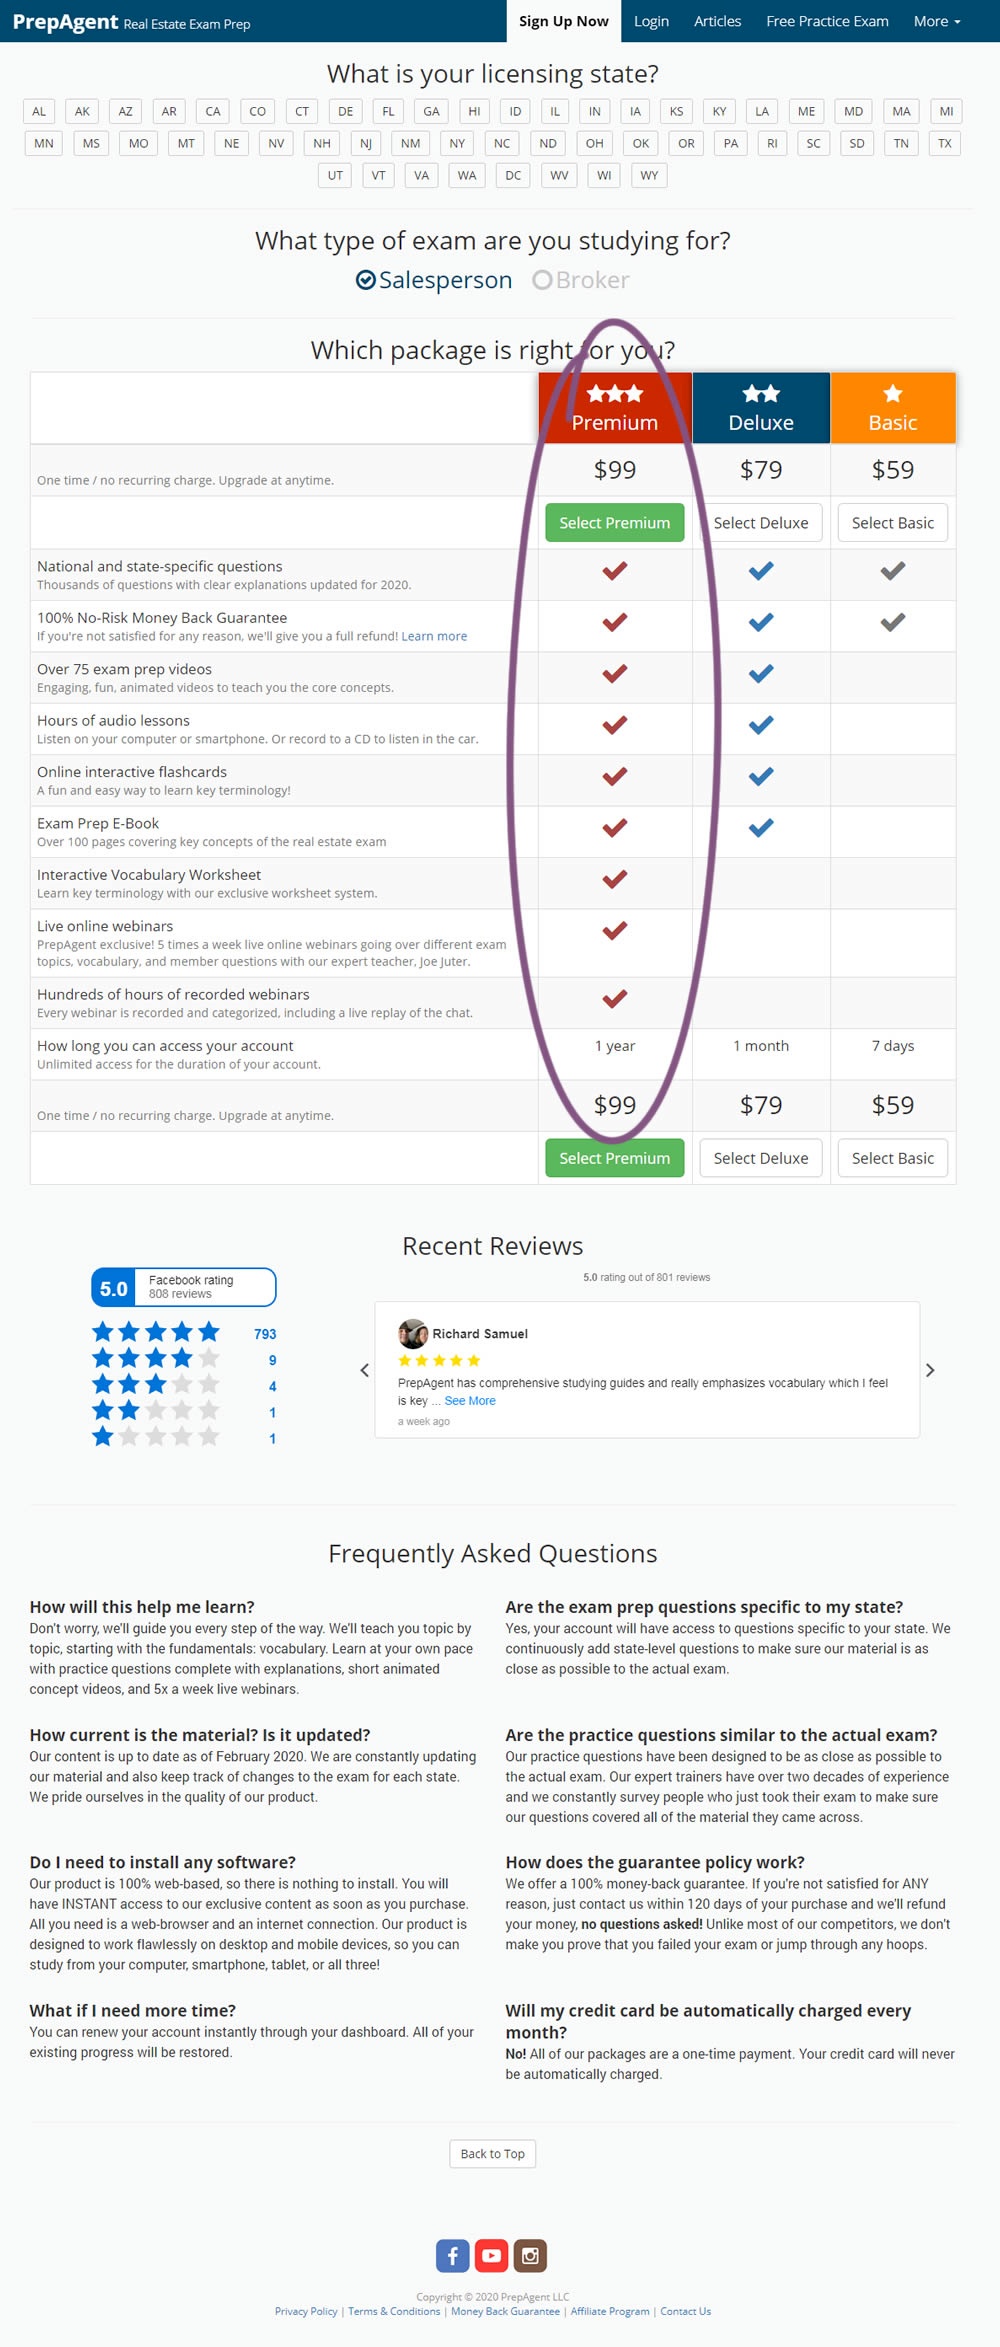
In this experiment, the order of pricing plans was rearranged as to show the most expensive one first.

Get Access To See The Test Results

Replaced

Isolated

Test # 254 on Volders.de by $conducted_test->test->user_->first_name . ' ' . $conducted_test->test->user_->last_name Alexander Krieger    Aug 16, 2019 Test link

Find Out How It Did

  • Measured by any successful cancellation transactions

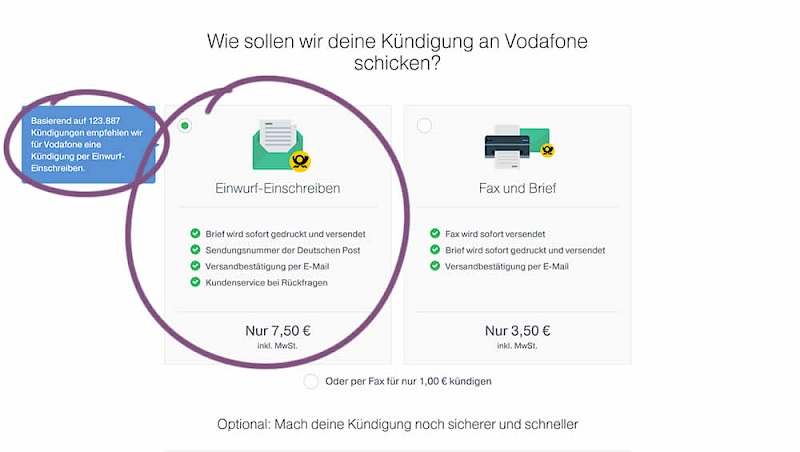
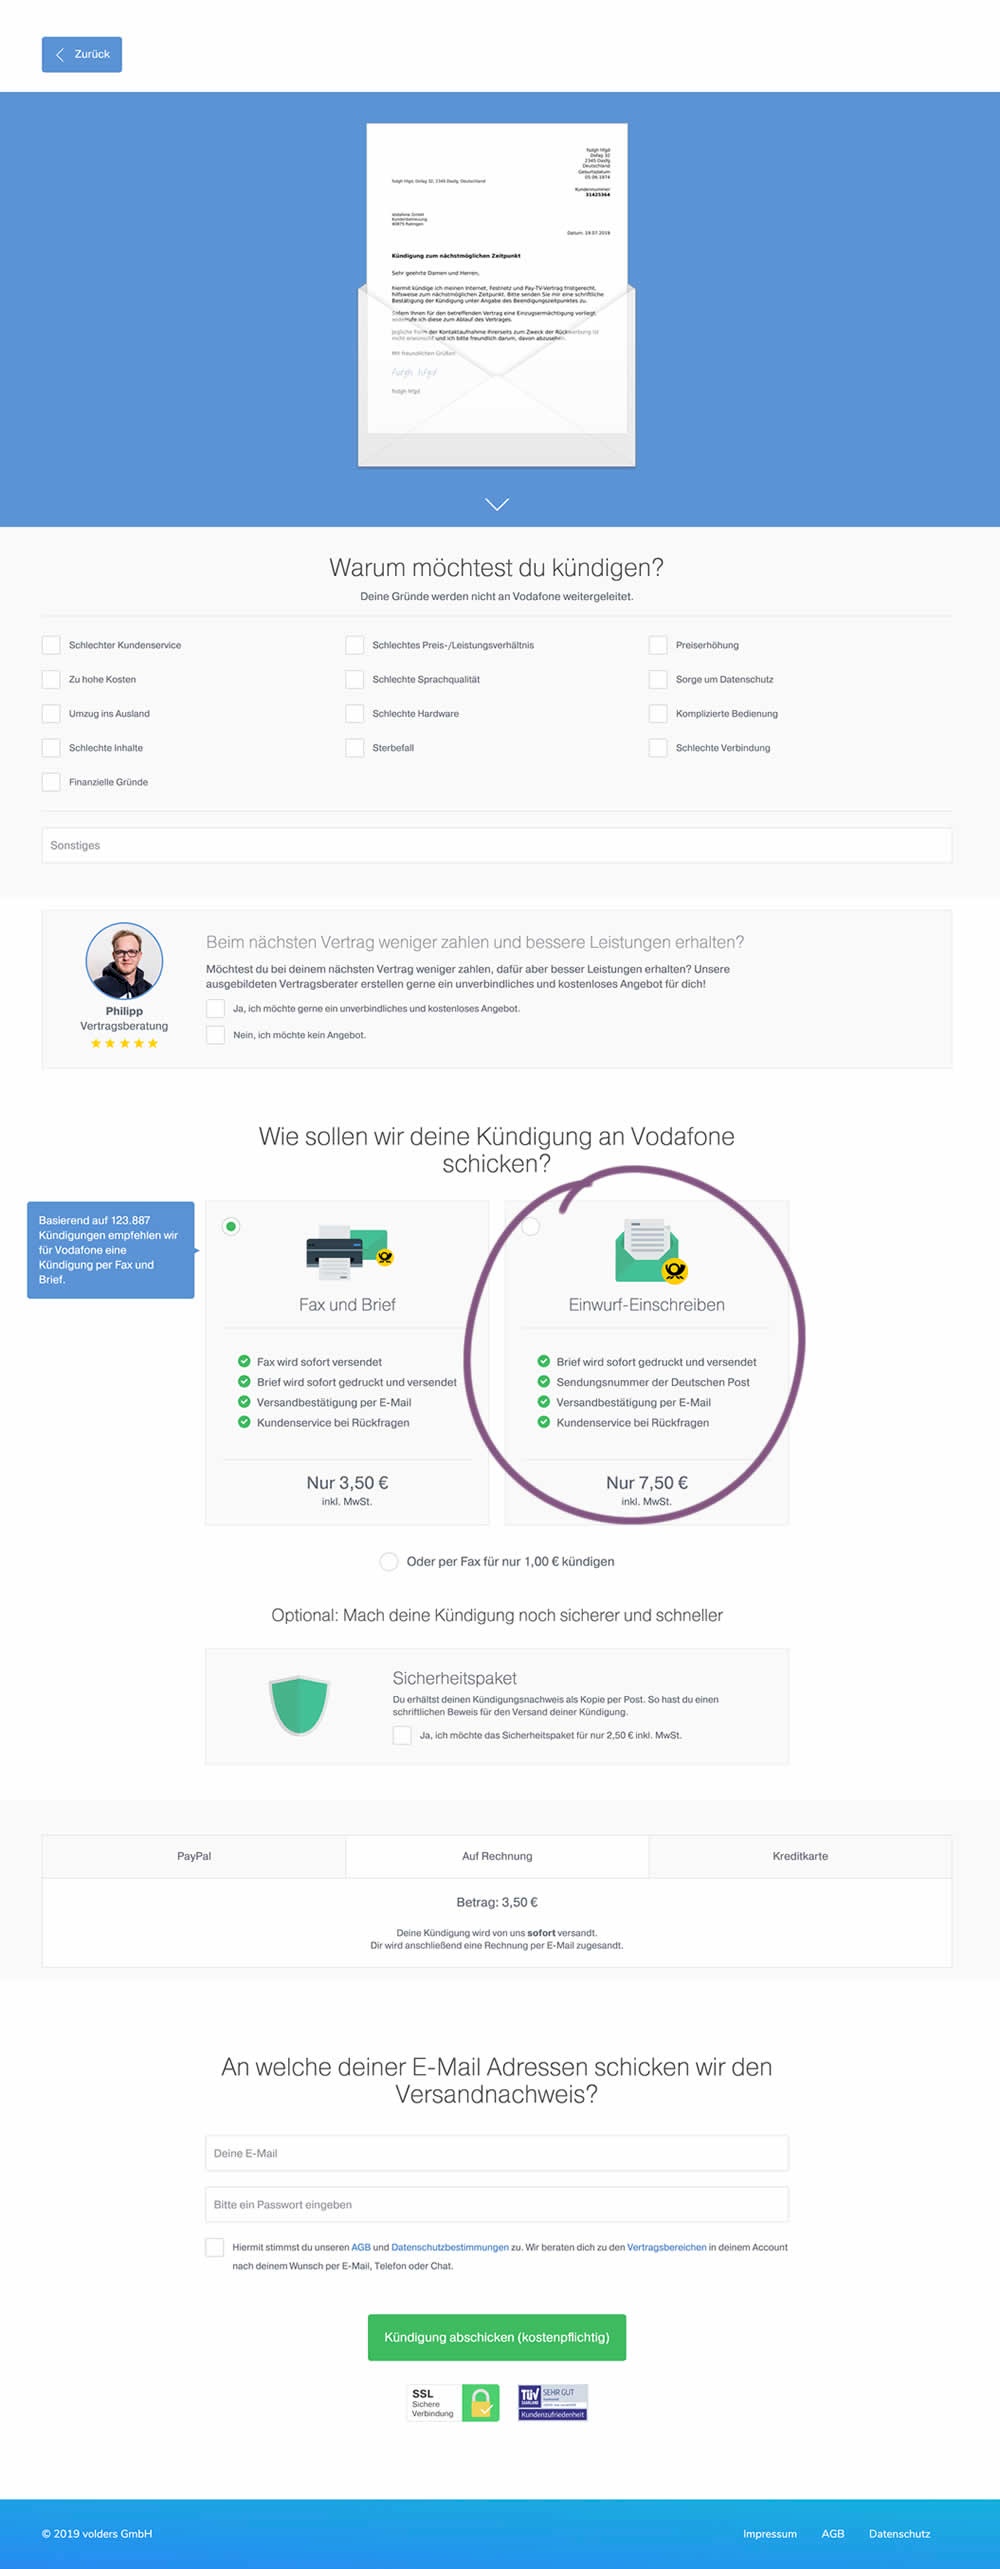
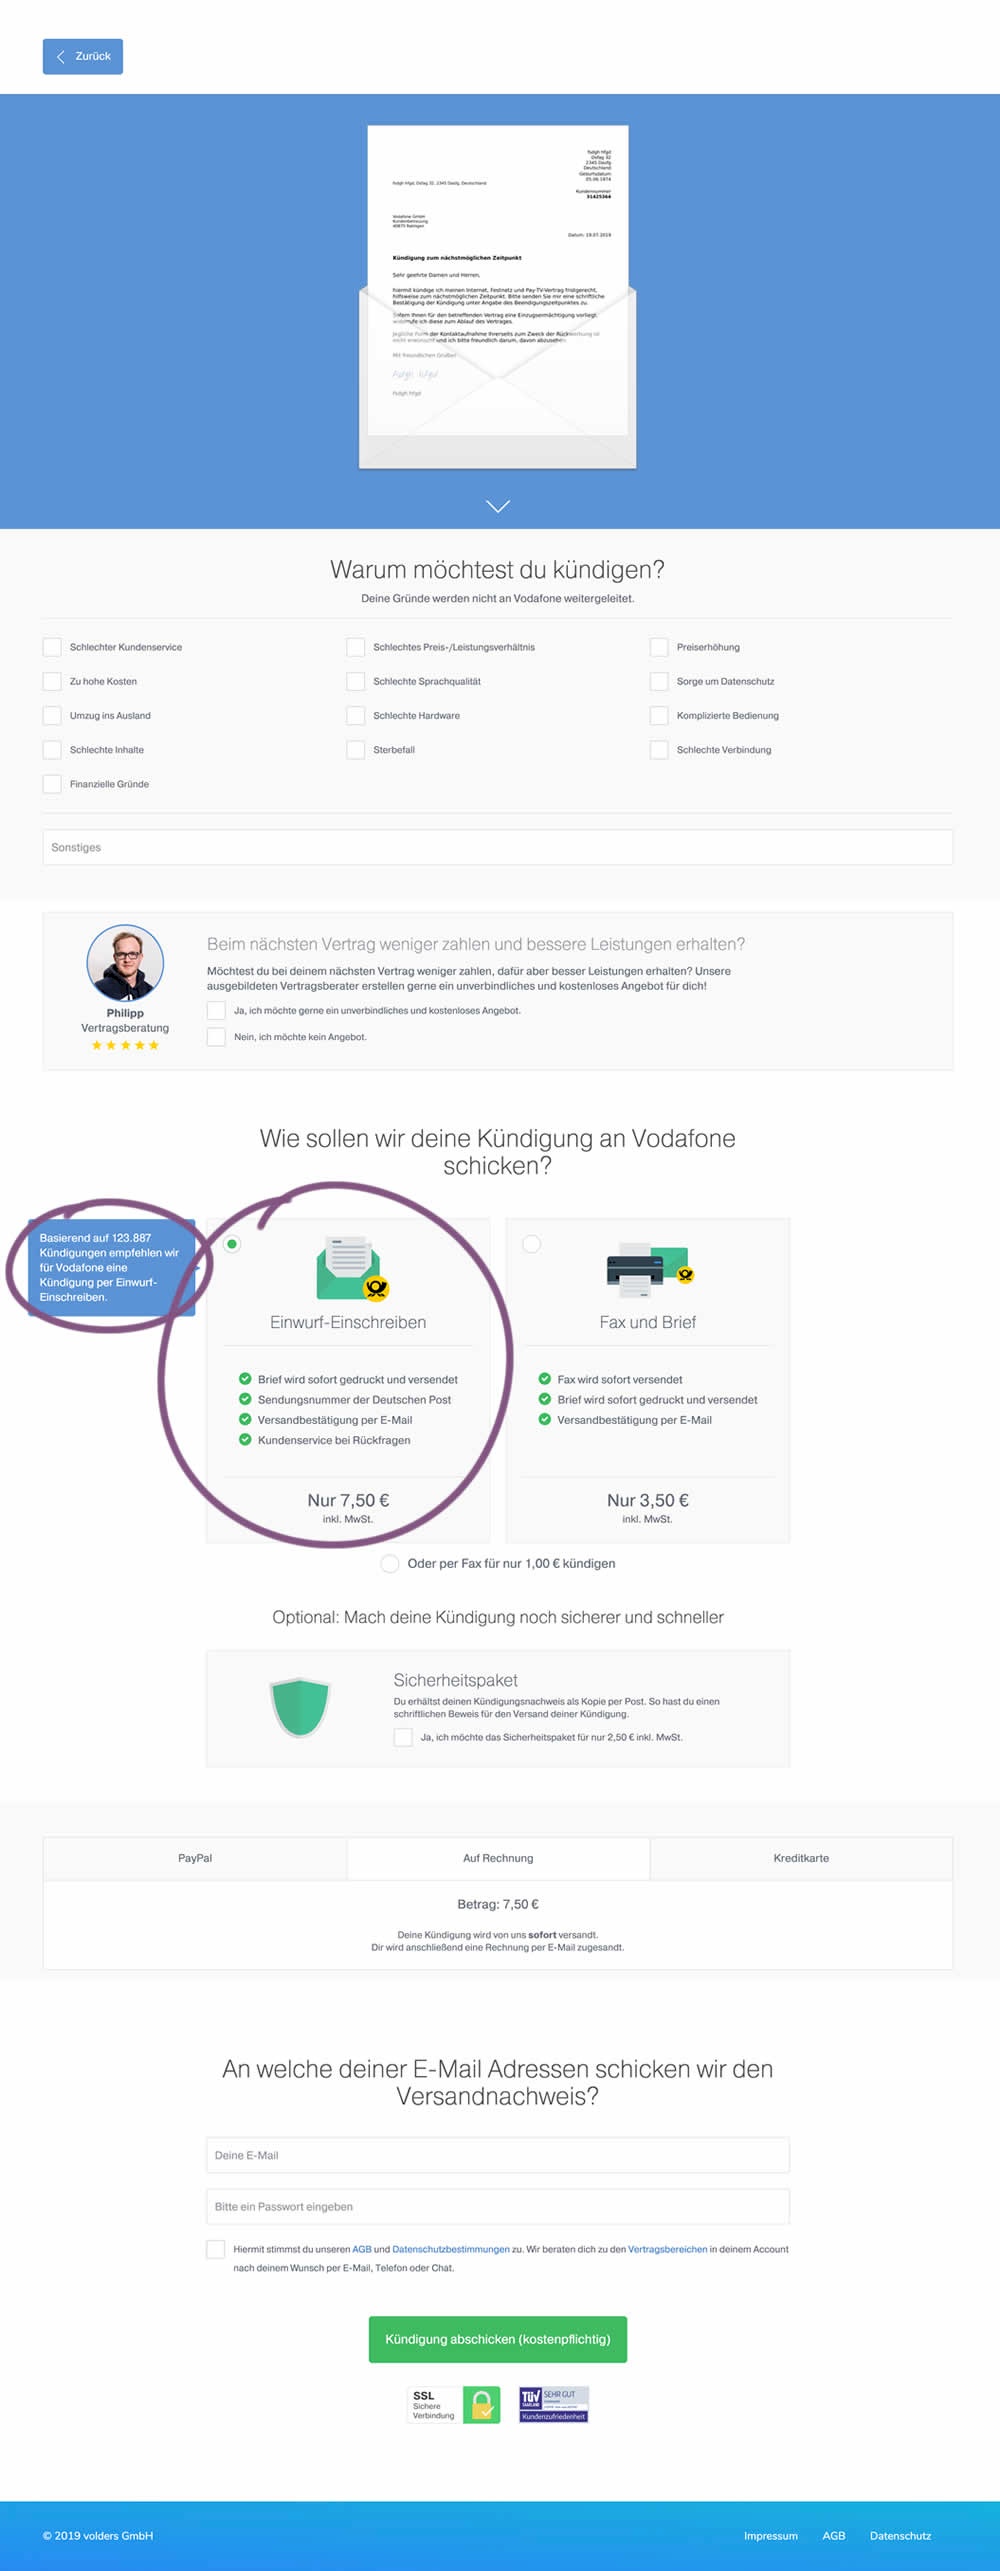
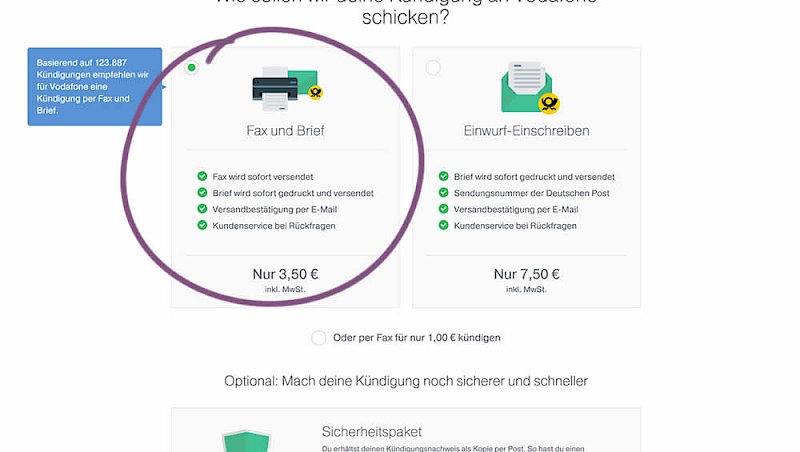
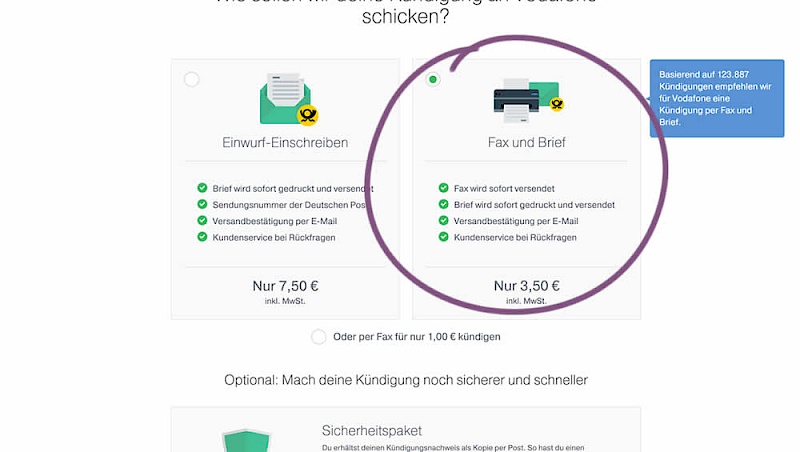
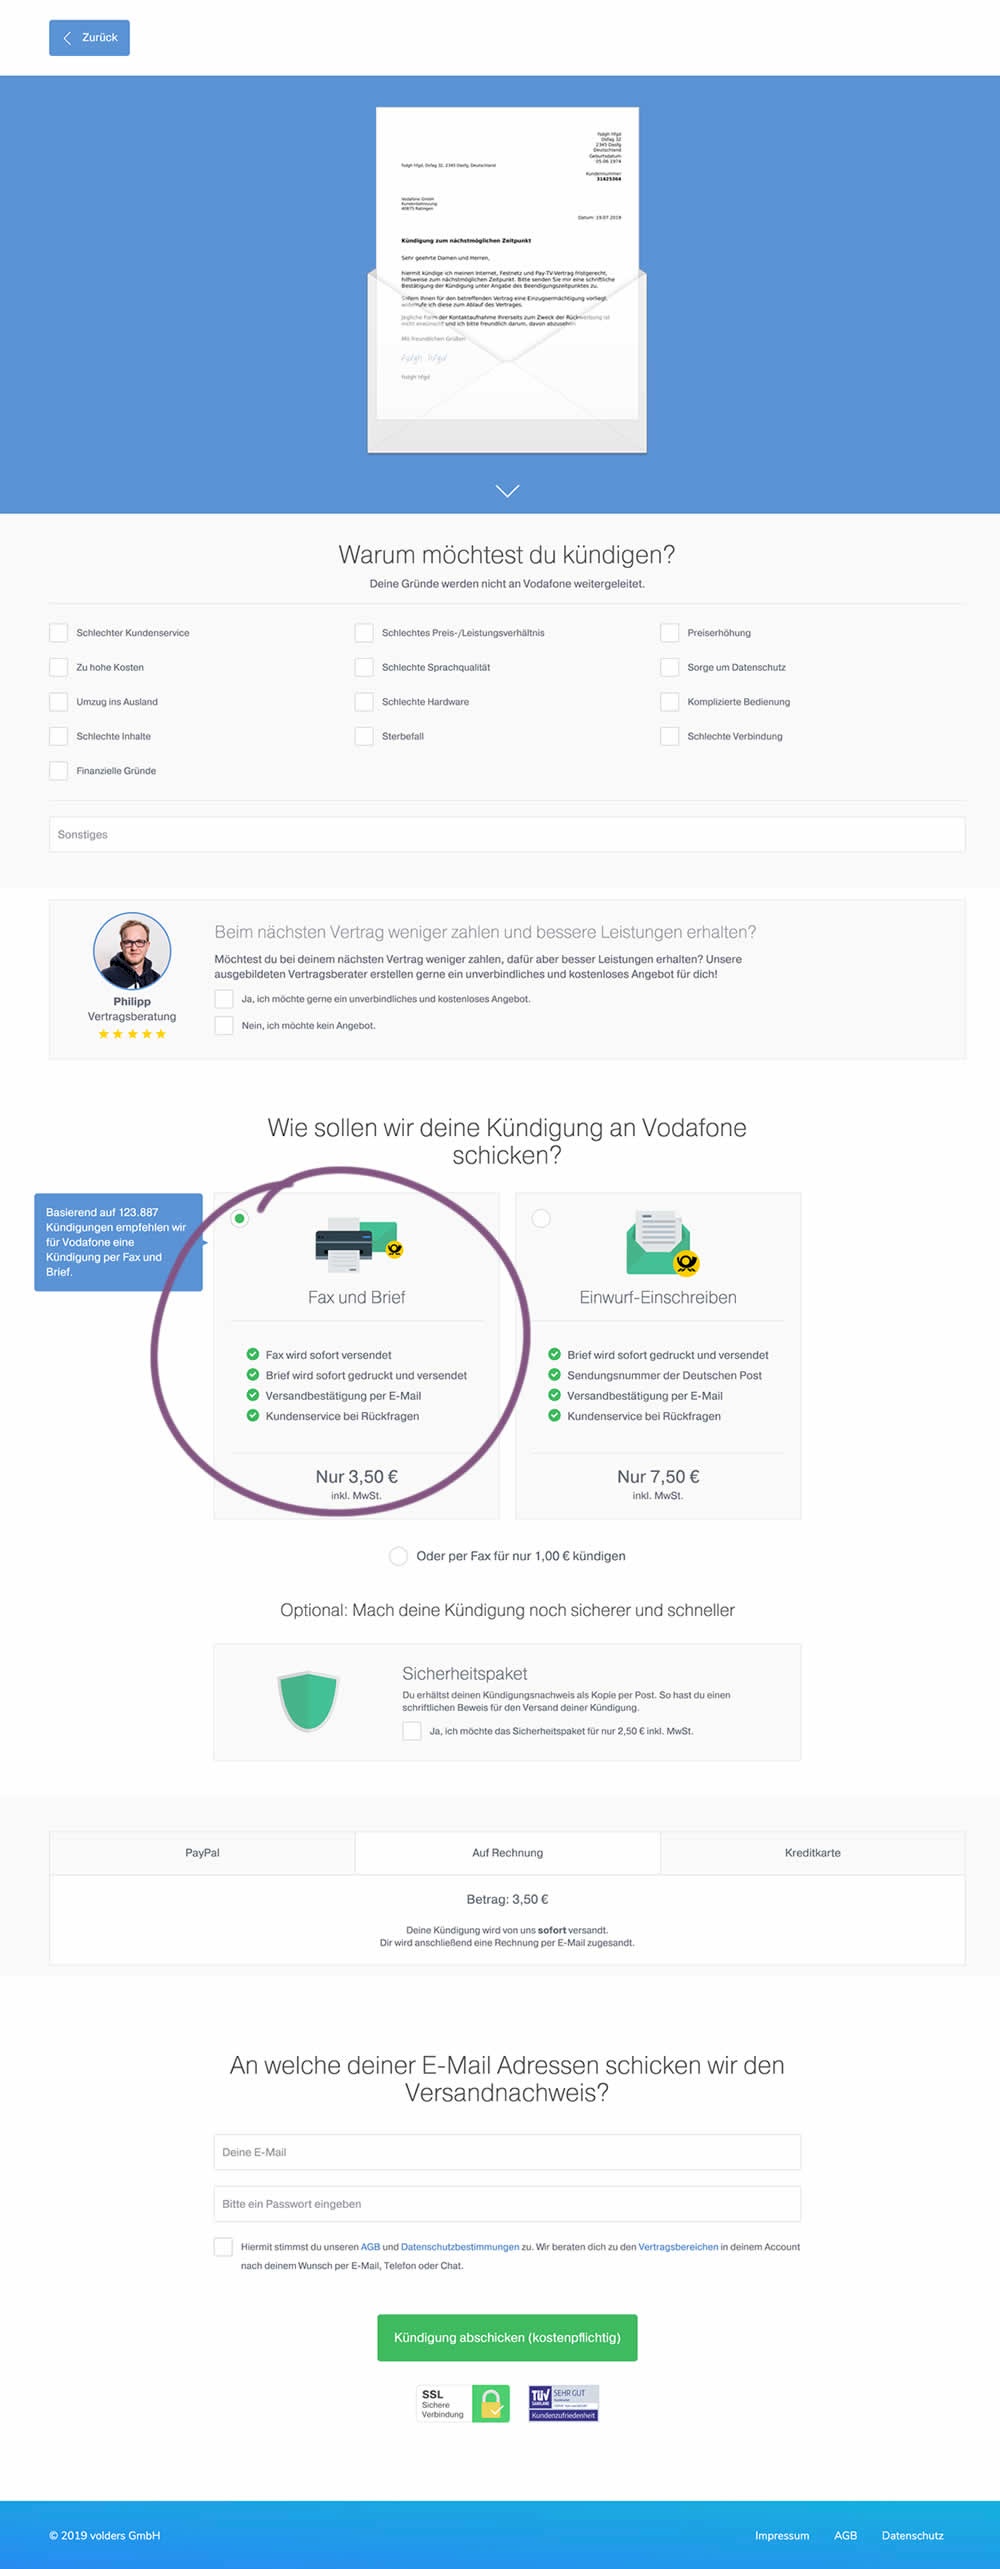
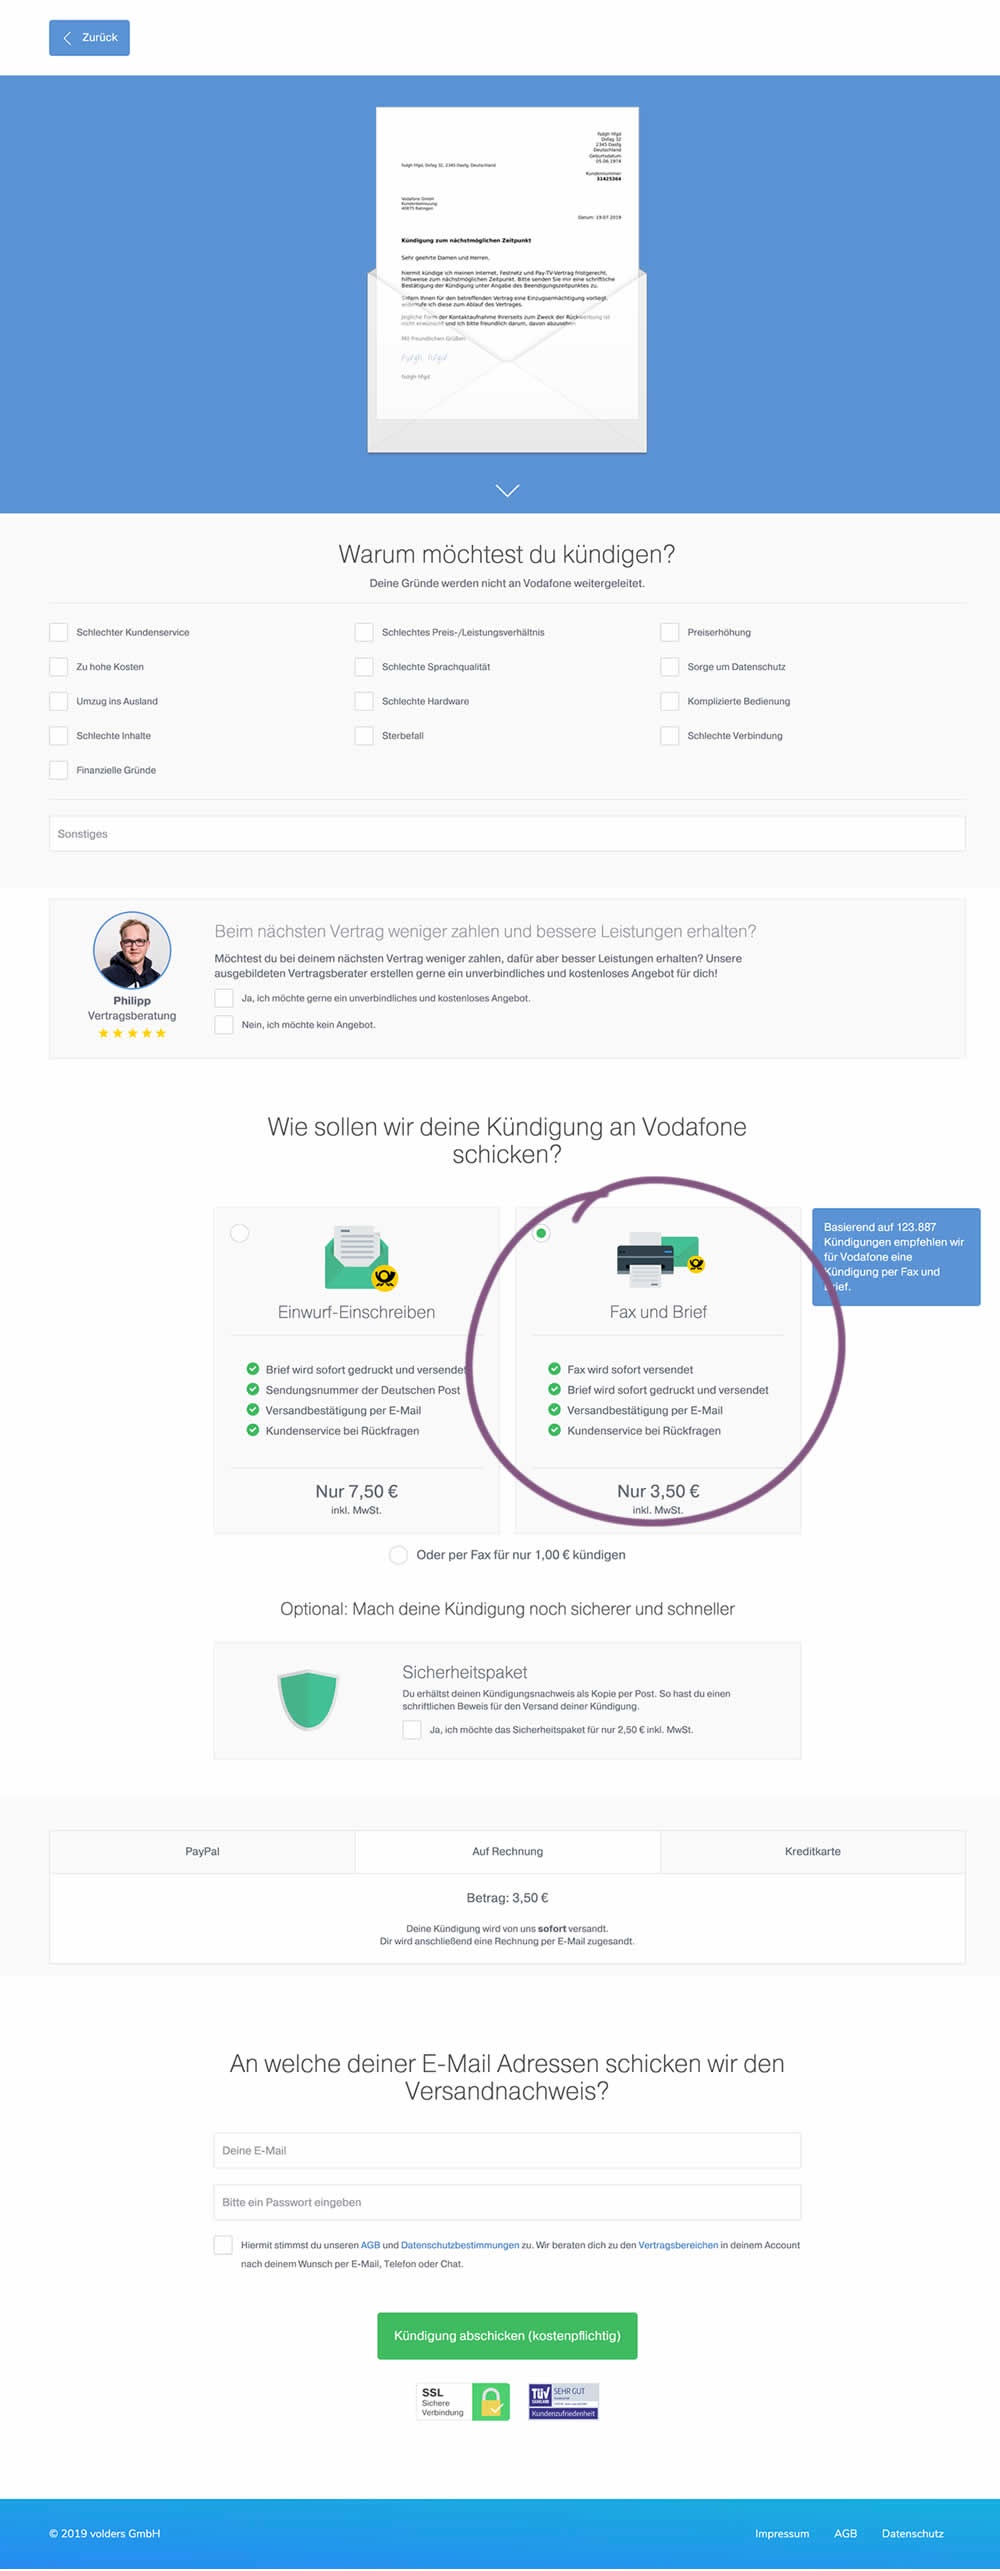
In this experiment, 4 things were adjusted in the variation: the highest pricing plan was shifted to the left, it was set as the default one, the recommendation was also adjusted to point to the highest plan, and one benefit from the lowest plan was removed (customer support).

Get Access To See The Test Results

Replaced

Isolated

Test # 253 on Volders.de by $conducted_test->test->user_->first_name . ' ' . $conducted_test->test->user_->last_name Alexander Krieger    Aug 08, 2019 Test link

Find Out How It Did

  • Measured by any successful cancellation transactions

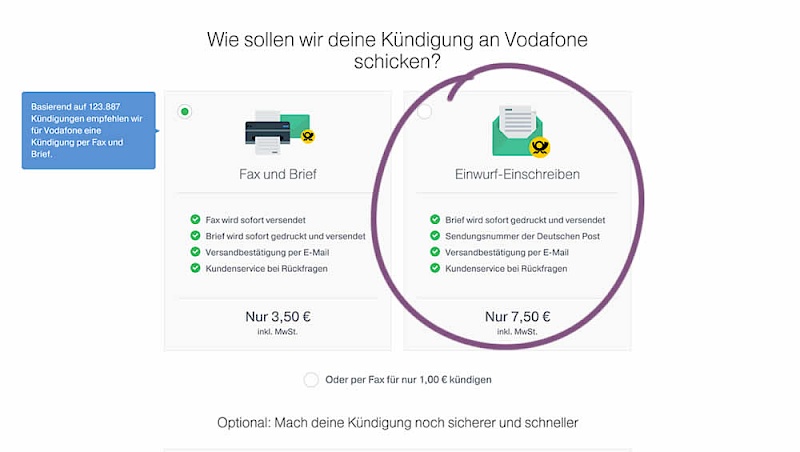
In this experiment, two pricing plans were inverted to show the most expensive plan first (in the variation).

Get Access To See The Test Results

Replaced

Isolated

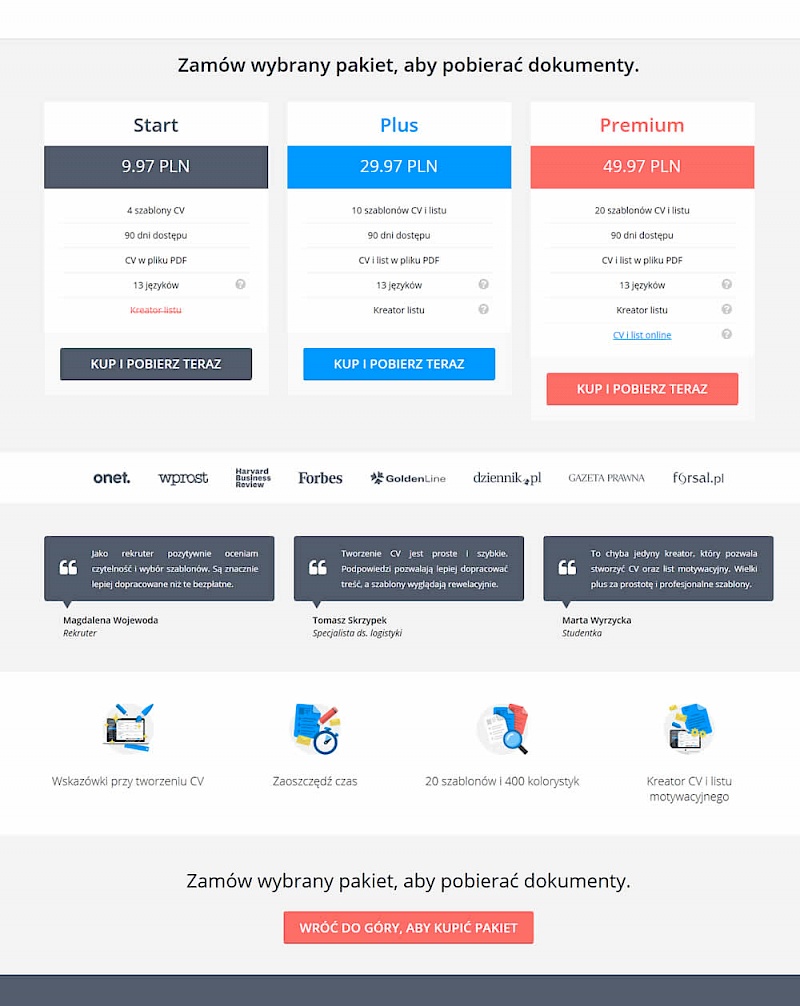
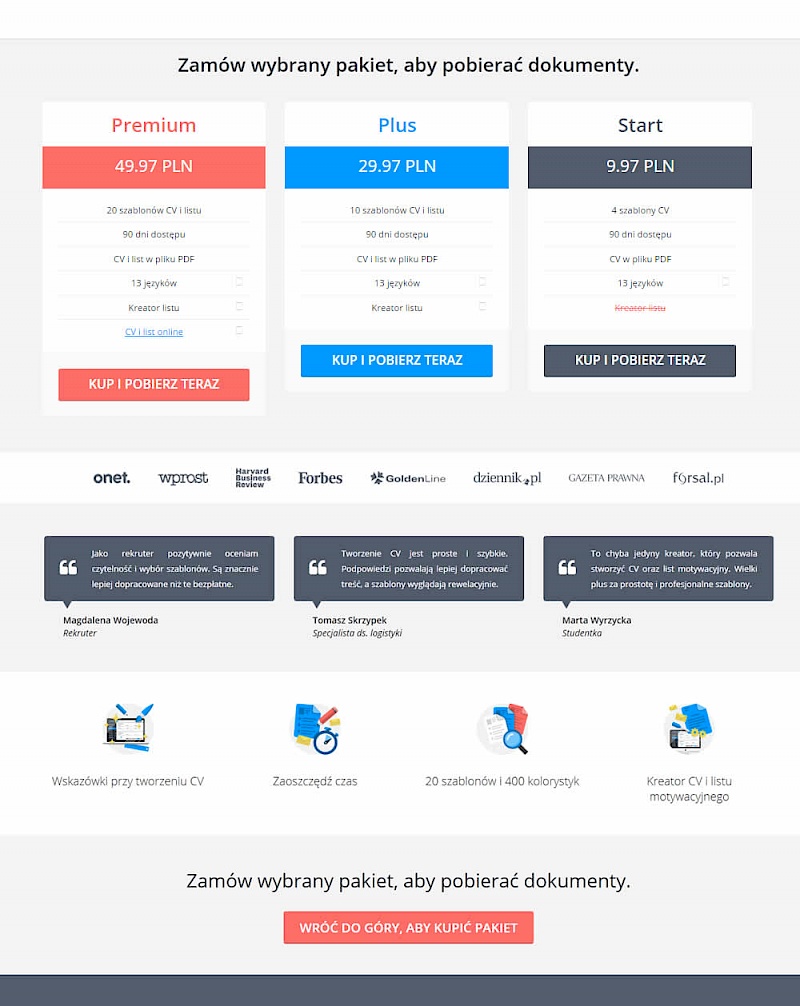
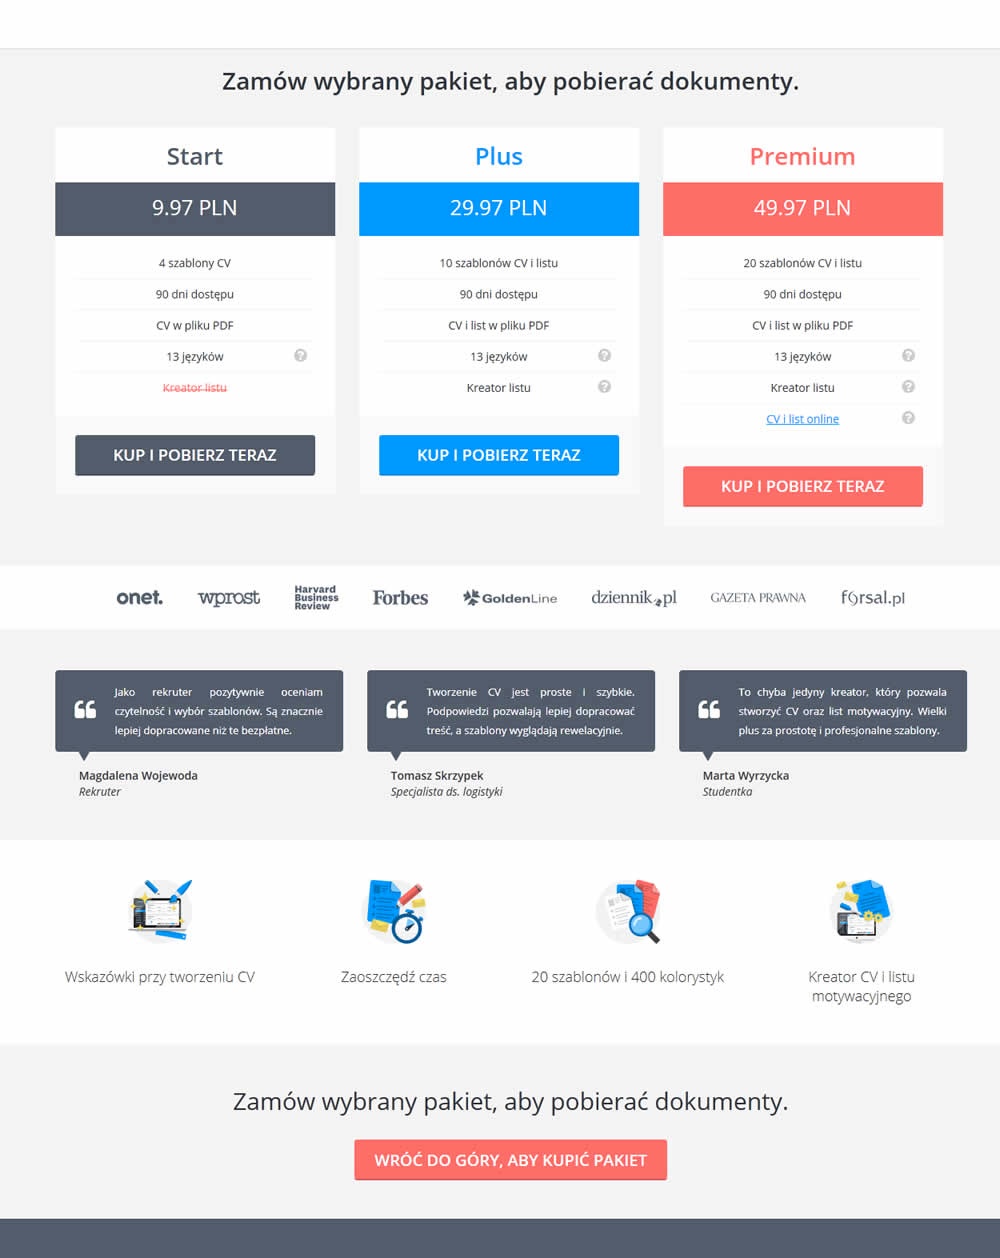
Test # 70 on Uptowork.com by $conducted_test->test->user_->first_name . ' ' . $conducted_test->test->user_->last_name Kuba Koziej    Nov 01, 2016 Test link

Find Out How It Did

  • Measured by any plan purchases

This test simply ordered the pricing plans from highest to most expensive. Overall sales decreased by an insignificant -1% with a possible +14% increase to the most expensive plan. The net effect was an insignificant 0.9% increase the the premium plans.

Get Access To See The Test Results

For each pattern, we measure three key data points derived from related tests:

REPEATABILITY - this is a measure of how often a given pattern has generated a positive or negative effect. The higher this number, the more likely the pattern will continue to repeat.

SHALLOW MEDIAN - this is a median effect measured with low intent actions such as initiating the first step of a lengthier process

DEEP MEDIAN - this is derived from the highest intent metrics that we have for a given test such as fully completed signups or sales.