Pattern #137: Visible Filters

Pattern #137  Tested 3 timesFirst tested by Andrey Andreev Recently tested by Clemens Grave on Oct 18, 2024

Based on 3 Tests, Members See How Likely Version B Wins Or Loses And By How Much

LOSSES
-5
-4
-3
-2
-1
FLAT
+1
+2
+3
+4
+5
WINS

Measured by the sum of negative and positive tests.

A B
Visible Filters (Variant A) Visible Filters (Variant B)

Expected Median Effects Of B

?

Progression

(4 tests)

-

Leads

-

Signups

-

Engagement

?

Sales

(2 tests)

-

Revenue

-

Retention

-

Referrals

?

ANY PRIMARY

(3 tests)

Tested on

Tests

Replaced

Isolated

Test # 541 on Online.metro-cc.... by $conducted_test->test->user_->first_name . ' ' . $conducted_test->test->user_->last_name Andrey Andreev    Jul 10, 2024 Test link

Find Out How It Did With 346,378 Visitors

  • Measured by Interaction with any filters

  • Measured by completed sales

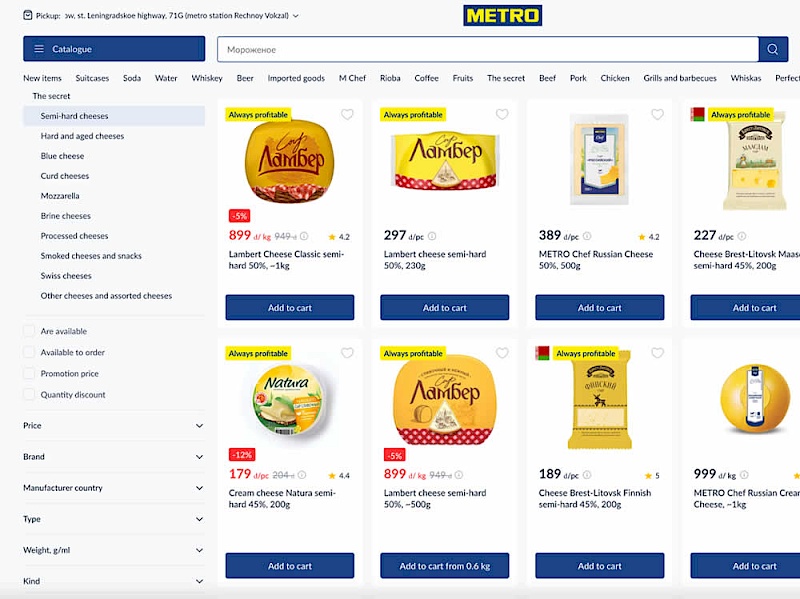
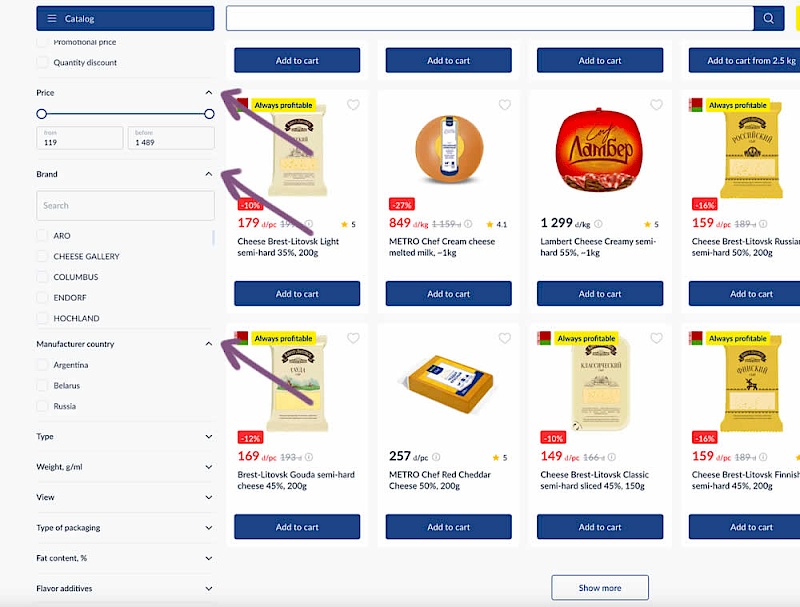
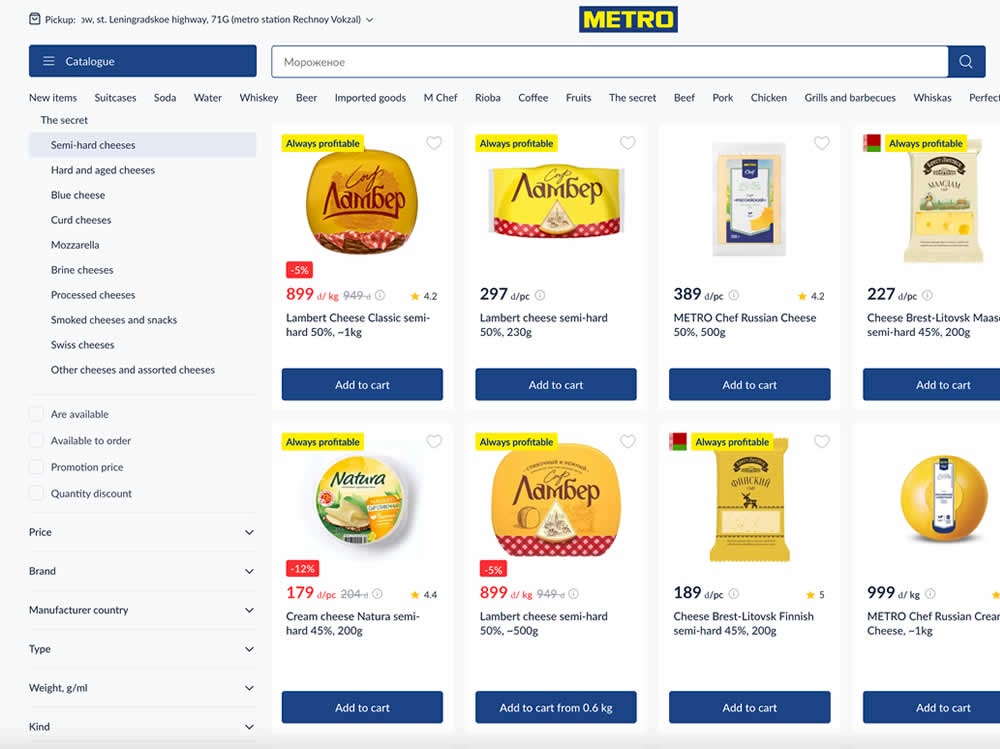
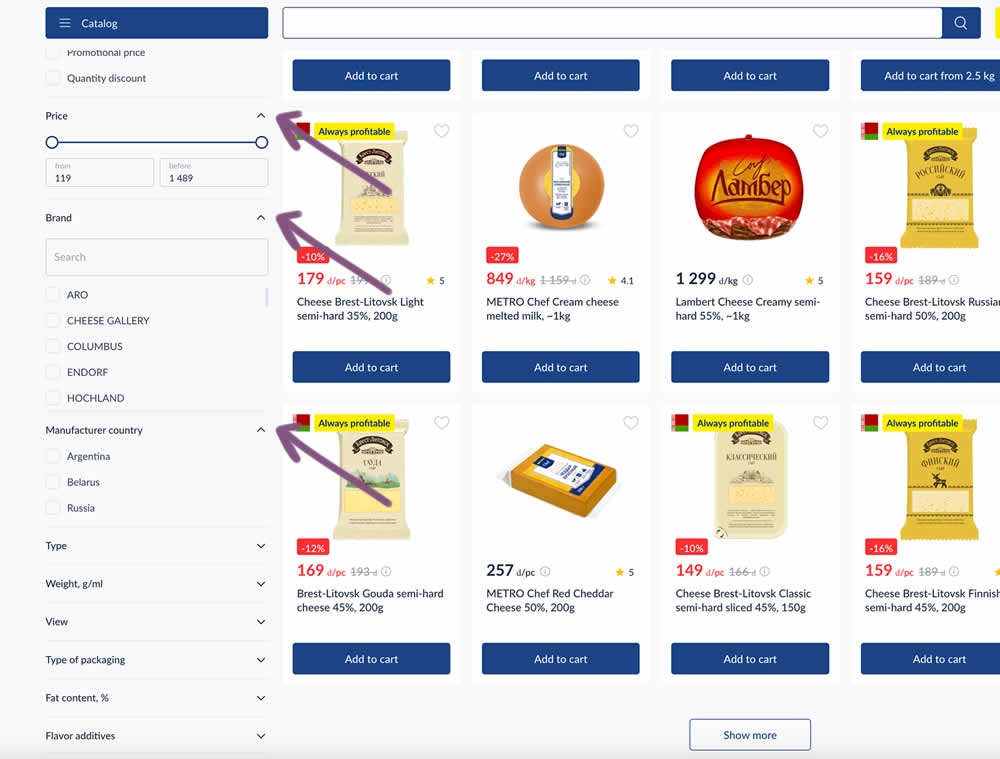
In this experiment, some side column filters were made more visible by being automatically expanded. These included: brand, price and country of manufacturing.

Get Access To See The Test Results

Replaced

Isolated

Test # 550 on Online.metro-cc.... by $conducted_test->test->user_->first_name . ' ' . $conducted_test->test->user_->last_name Andrey Andreev    Aug 14, 2024 Test link

Find Out How It Did With 312,289 Visitors

  • Measured by application of filters

  • Measured by completed purchases

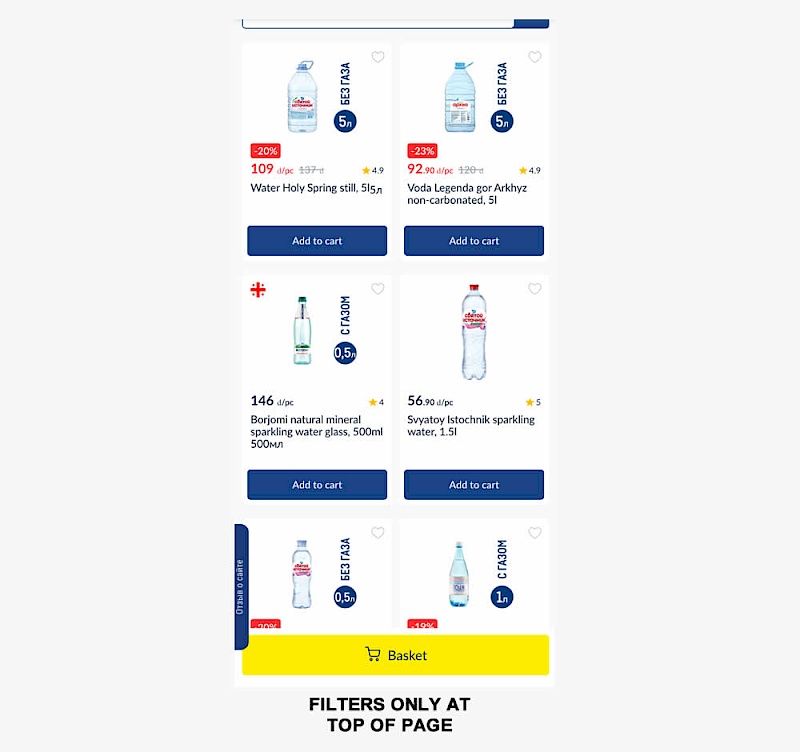
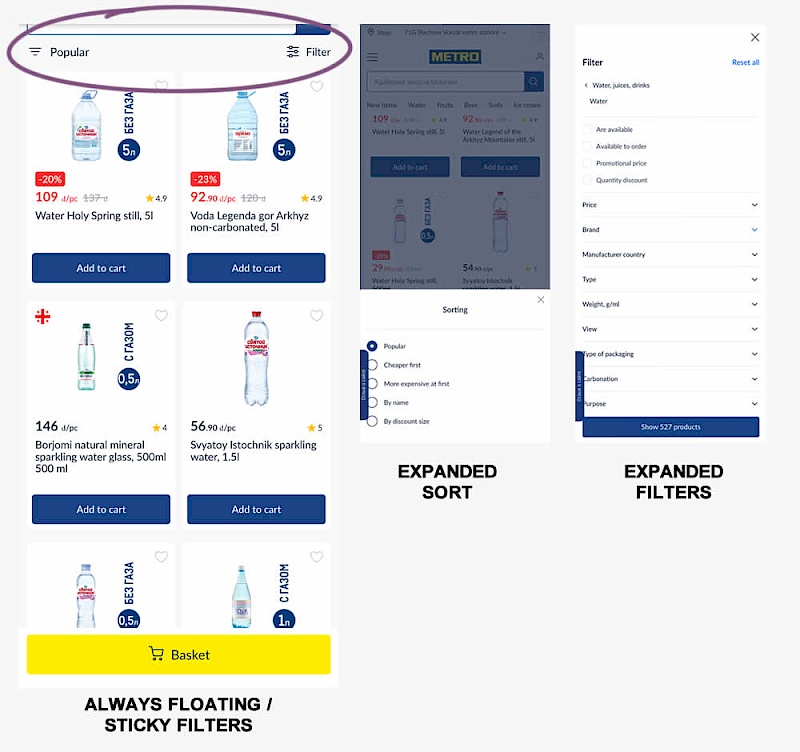
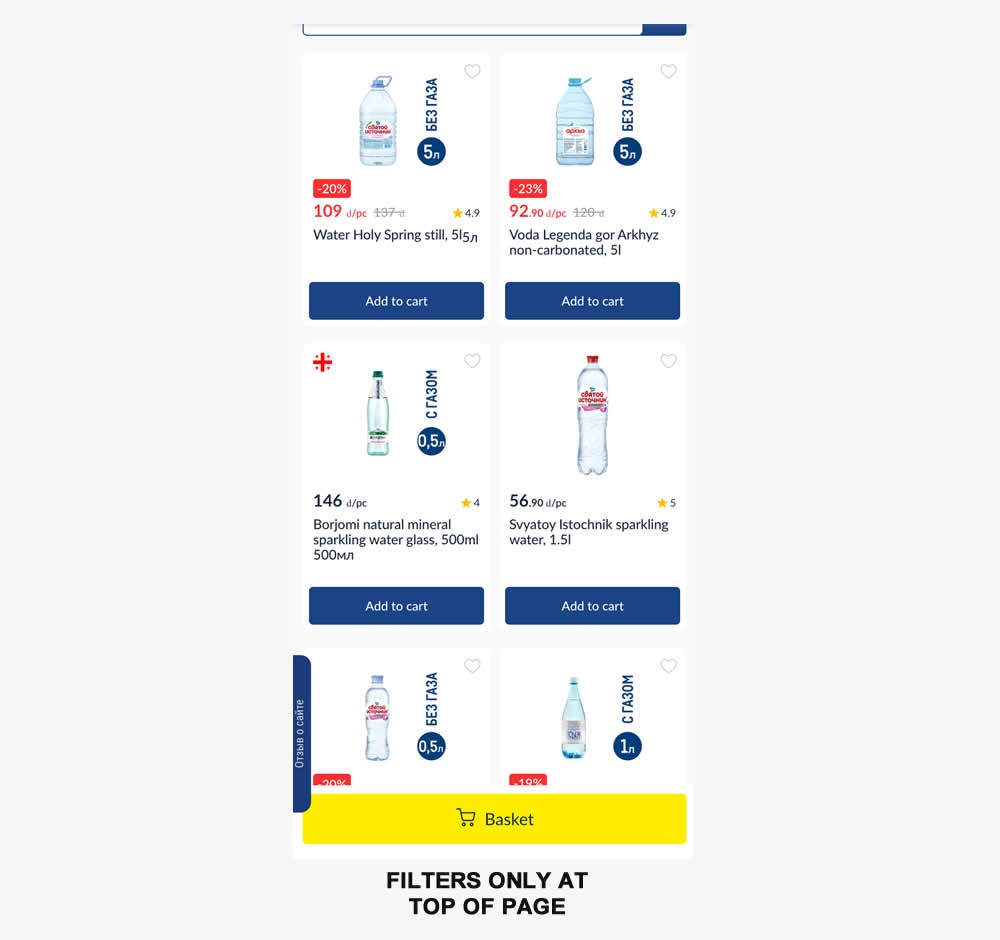
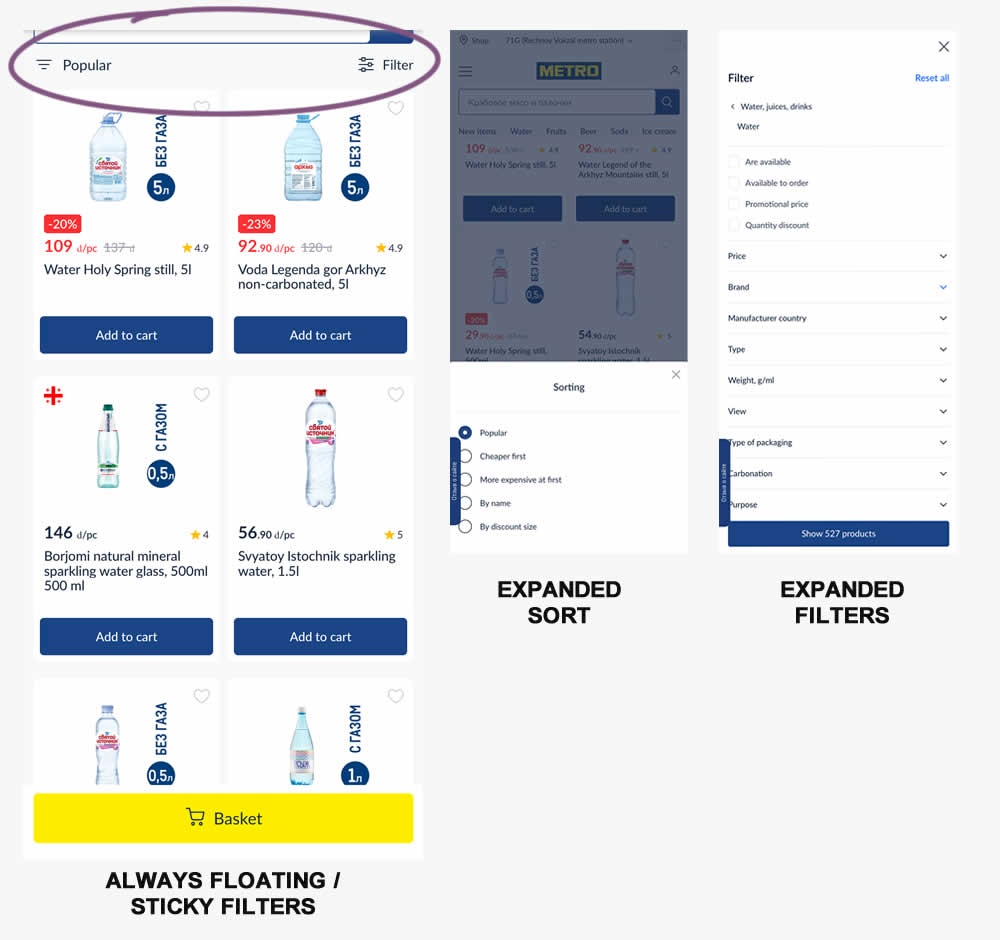
Instead of only displaying sort and filters at the top of a listing page, the variation always had them visible with a sticky/floating interaction. Impact on sales was measured.

Get Access To See The Test Results

Replaced

Isolated

Test # 559 on Tourradar.com by $conducted_test->test->user_->first_name . ' ' . $conducted_test->test->user_->last_name Clemens Grave    Oct 18, 2024 Test link

Find Out How It Did With 36,470 Visitors

  • Measured by interaction with filters

  • Measured by visited product detail page

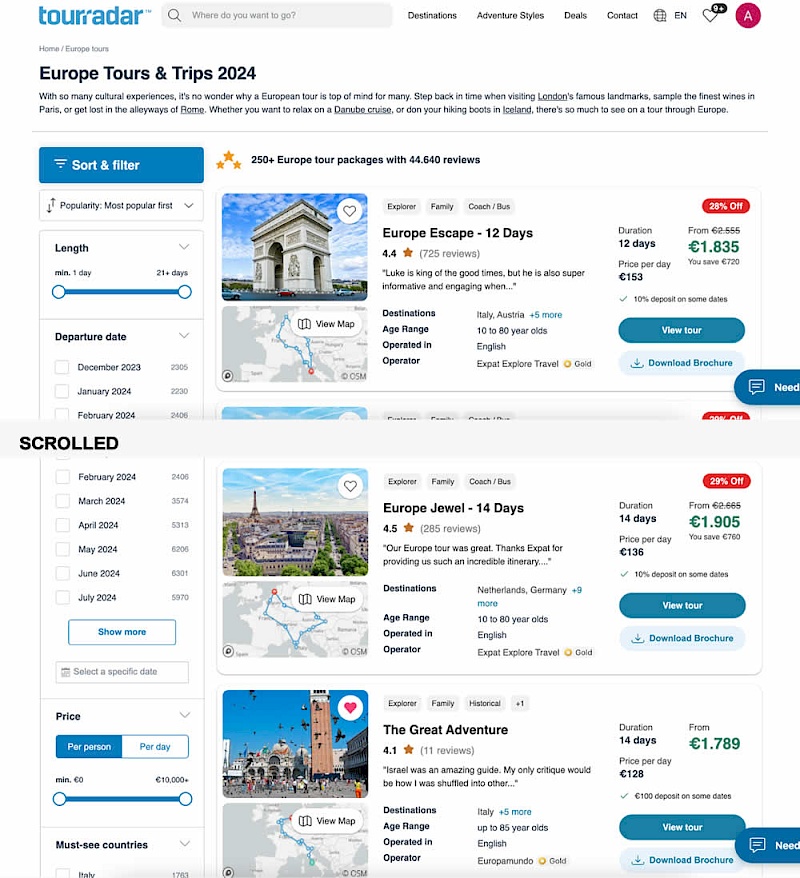
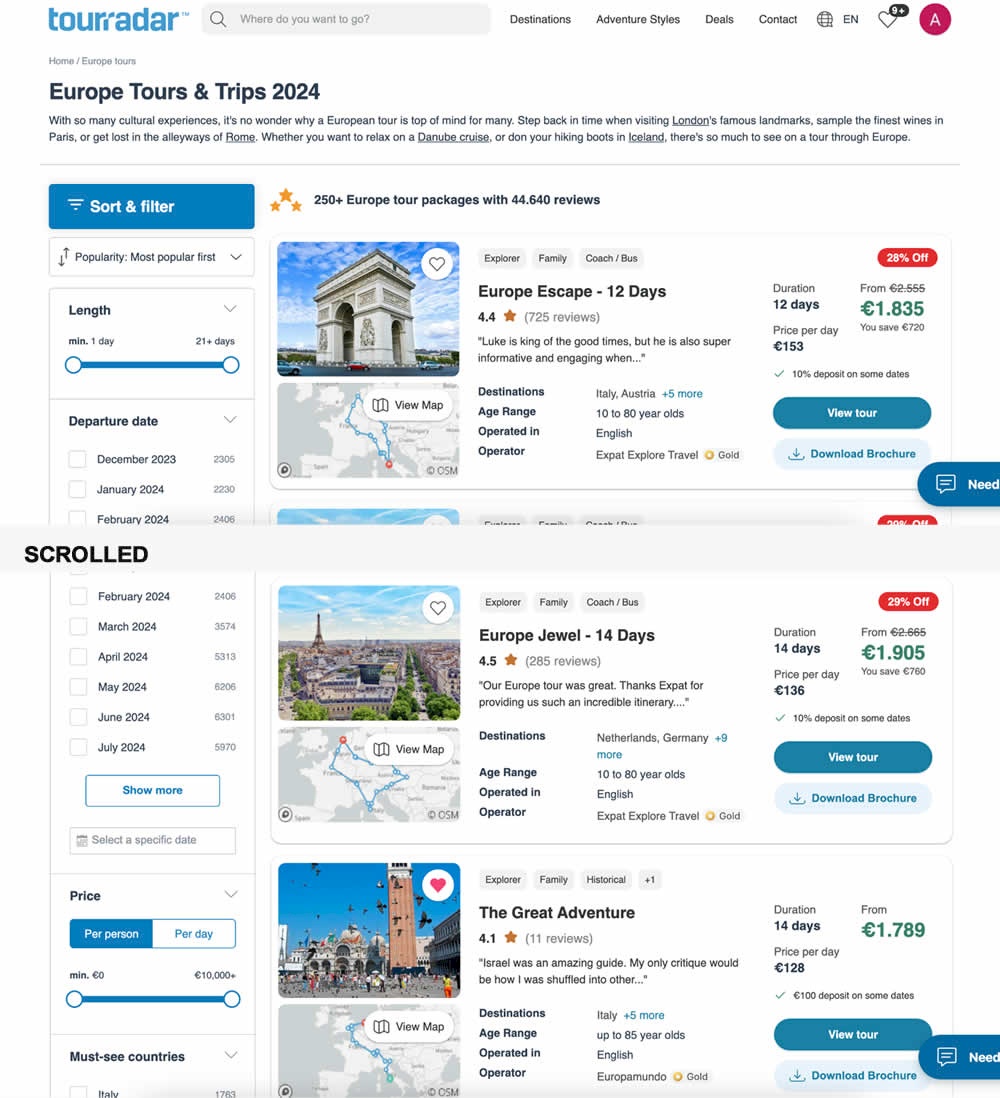
In this experiment, left column filters (control) were tested against top-aligned and sticky filters (variation). The hypothesis was to increase their visibility. Impact on their use and progression to next step (product/tour detail page) were measured.

Get Access To See The Test Results

For each pattern, we measure three key data points derived from related tests:

REPEATABILITY - this is a measure of how often a given pattern has generated a positive or negative effect. The higher this number, the more likely the pattern will continue to repeat.

SHALLOW MEDIAN - this is a median effect measured with low intent actions such as initiating the first step of a lengthier process

DEEP MEDIAN - this is derived from the highest intent metrics that we have for a given test such as fully completed signups or sales.