Amazon A/B/C/D/E Tests And Discovers Better Product Information For Their Listing Tiles
Here is another super interesting online experiment captured in around June 2023 from Amazon. The online giant has been aggressively a/b testing what information to show on their product tiles as displayed on search result and listing pages. I managed to detect at least 4 sibling variations. Two months later, one version with the combined elements (shown as variation E) seems to have been rolled out - hinting at hifgher optimality and a really great test design.
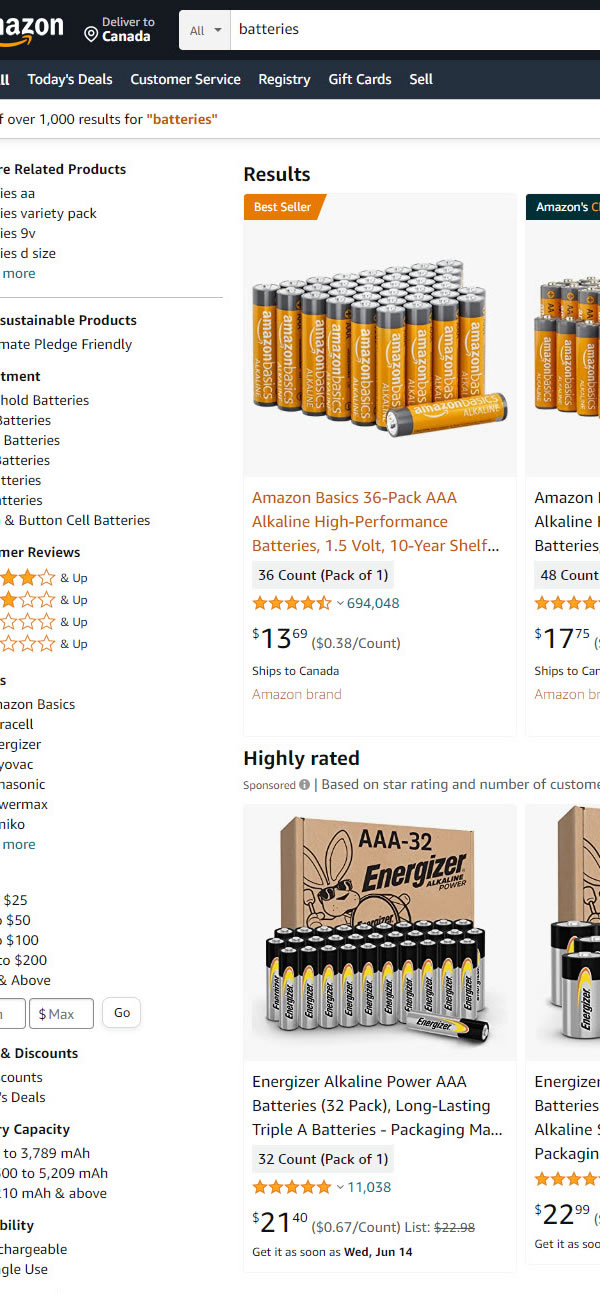
E - Jun 6, 2023 Screenshot
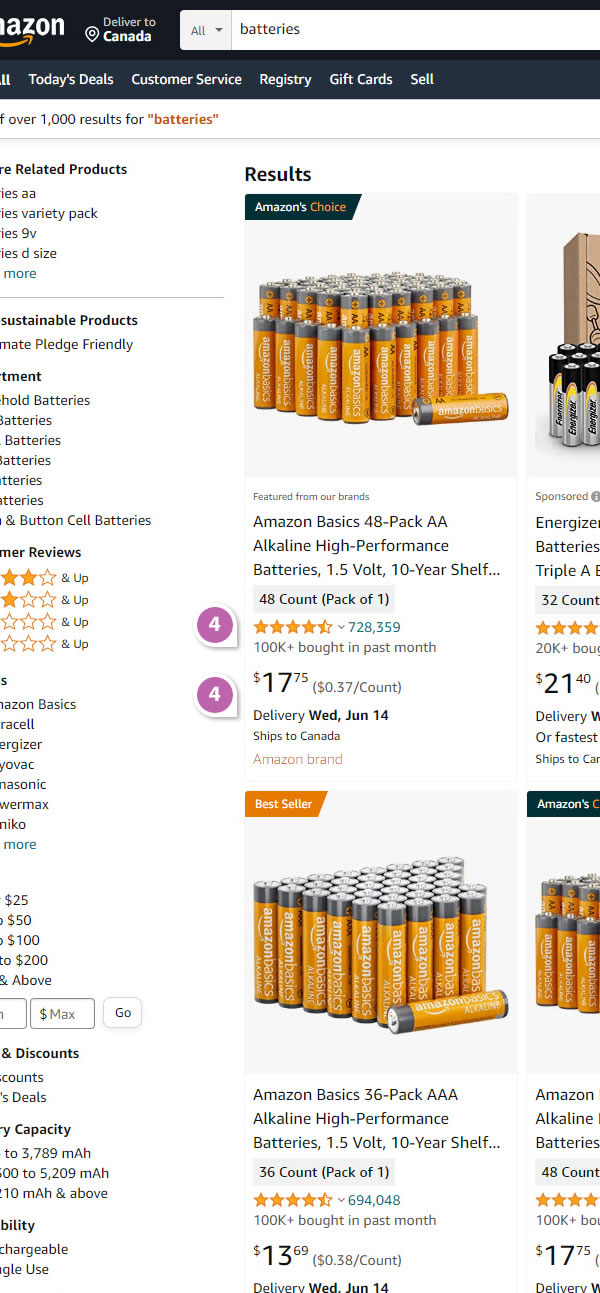
Highlighted UI Changes From This Leak
-
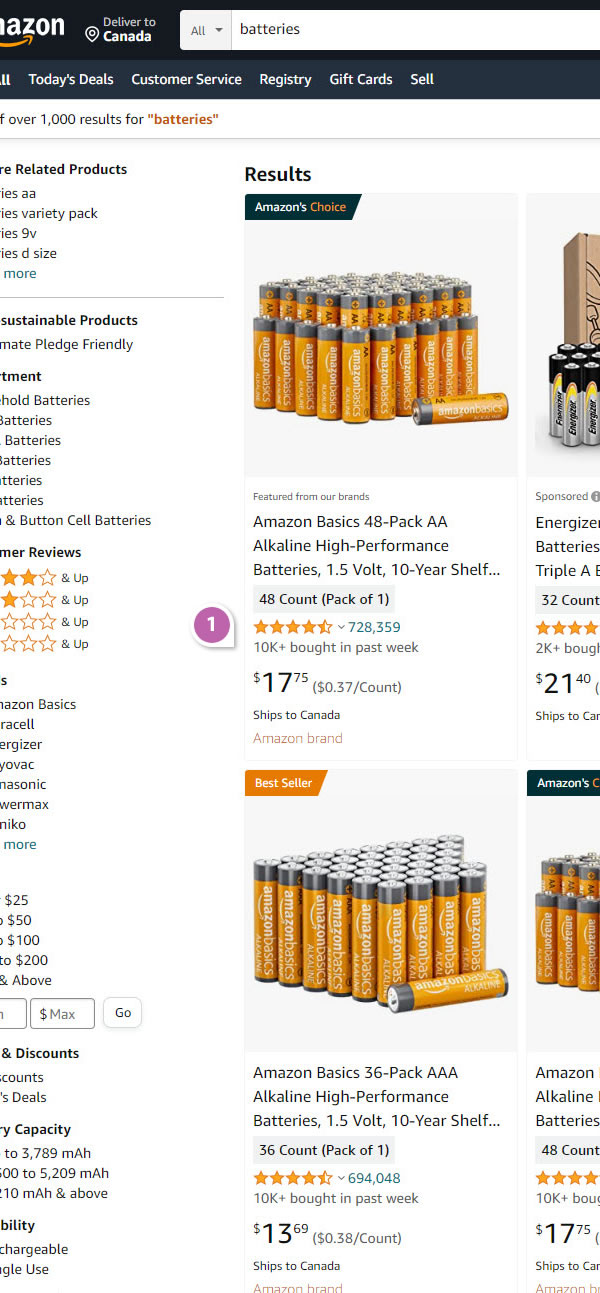
Social Proof (Weekly Range): X bought in the past week
In the first B variation we see a form of social proof that shows how many customers have purchased this product in the last week.
This is very similar to Pattern #7: Social Counts
-
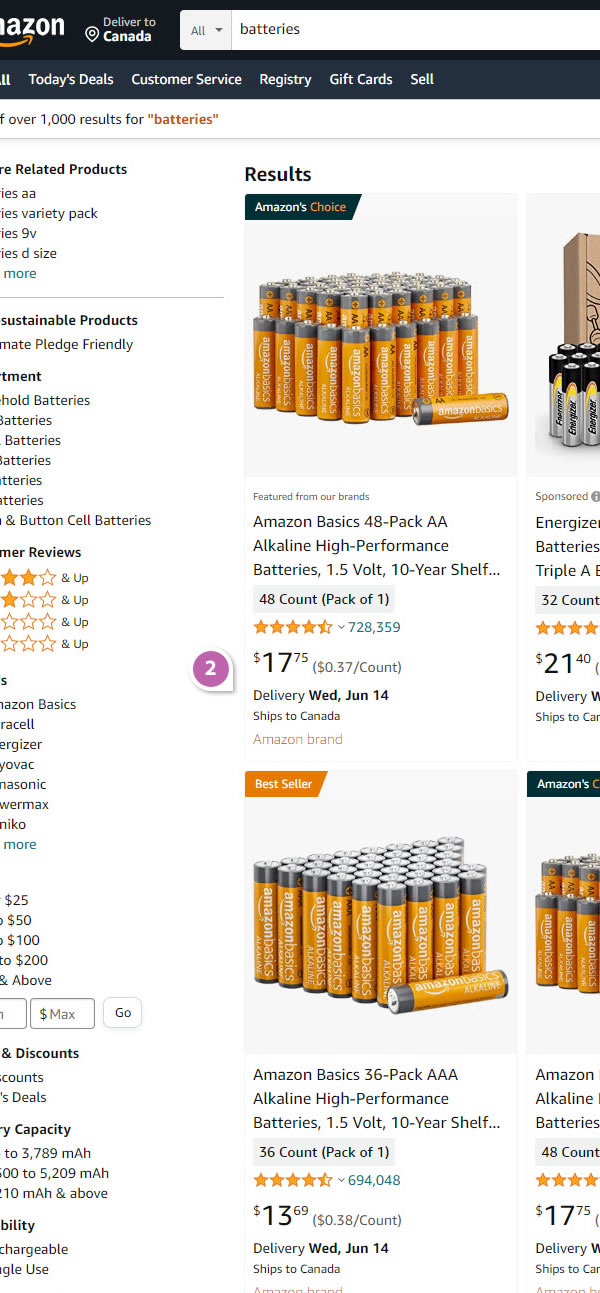
Delivery Timeframe
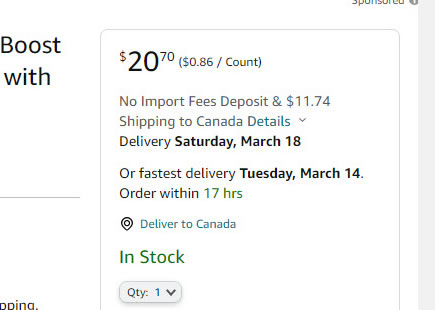
In the next (C) variation we see the addition of a possible earliest delivery date of the product.
This is very similar to Pattern #62: Urgent Next Day Delivery
-
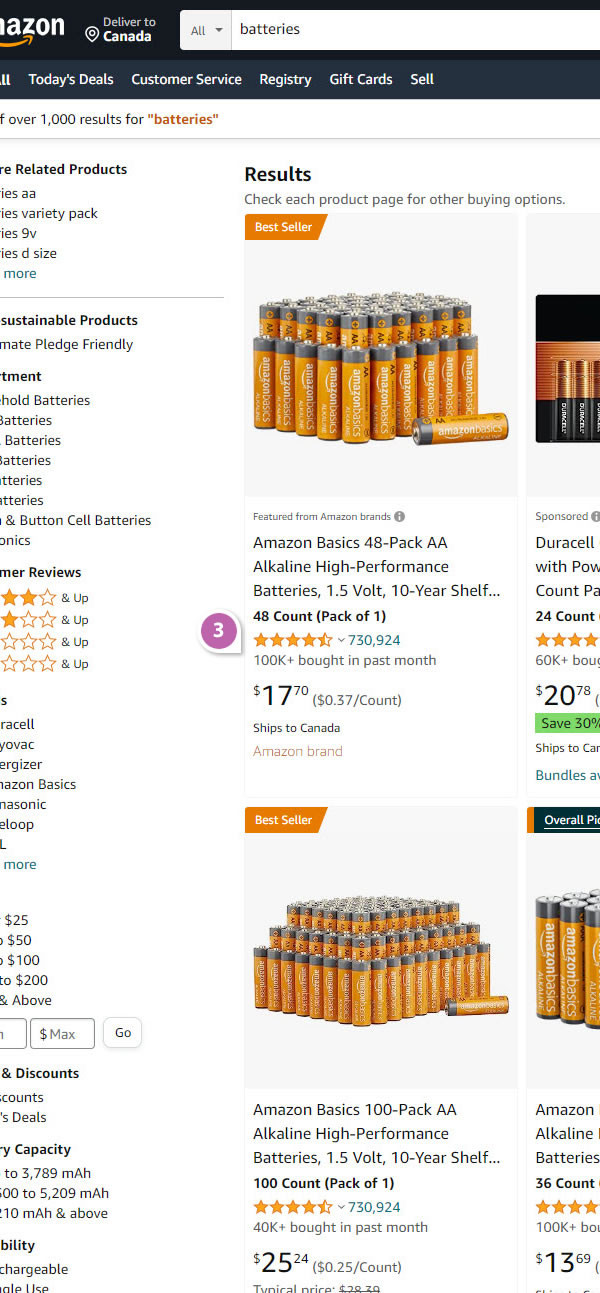
Social Proof (Monthly Range): X bought in the past month
Similar to the B variation, the D variation extends the social proof range to a month (with a higher number of customers who have purchased the product). A very interesting "intensity" setup.
-
All Together: C + D
I also managed to detect a variation (or possibly two overlapping experiments) where both C and D were combined together. Given the implementation we can probably make an inference that:
B < C
A, B, C, D < C + D


Comments